Save hours on social, every day.
Automate moderation and replies, schedule posts, and pull reports - all in one tool.
Short-form video content has surged in popularity ever since Snapchat started pulling in the young crowd. And, since 2016, Instagram users have had Stories to get creative with.
Now that sticker-happy Tik Tok has claimed their place in social media platform history with what has to be one of the quickest global takeovers we’ve seen, marketers are spending more than ever on video content.
And with consumers consuming more short-form video than ever before, how can you take full advantage of the Stories effect? The answer lies in understanding the metrics and applying data-driven insights to hone your approach.
So, in this article, we’ll cover the what, how, and why of Instagram Stories metrics, so you can be pitch-perfect on the world’s sixth most popular social platform.
In-depth Instagram Analytics
Measure your Instagram marketing results. Track competitors and improve performance – with an all-in-one social media tool.
What is Instagram Stories analytics?
If you’re new to Stories posts, you’re probably wondering why everyone talks about Stories analytics like it’s not just Instagram Insights.
While Stories analytics appear in Insights, their metrics are unique. There’s not much overlap between Instagram Post metrics and Instagram Stories metrics. So, the way you keep track of Stories won’t be the same as the way you keep on top of other Instagram content.
Which brings me to our next question…
How do you analyse Instagram Stories?
Unlike Instagram posts, Instagram Stories don’t have Like, Comments, Shares and Saves. So, you need to:
- Understand Stories-specific metrics
- Use Insights to track these metrics
- Work out how to interpret the associated data
There are two ways to access this data in Instagram:
- Analyse individual posts from your Profile
- Find Stories-specific data in Instagram Insights
We’ll take a look at both methods below.
Analyse Instagram Stories from your Profile
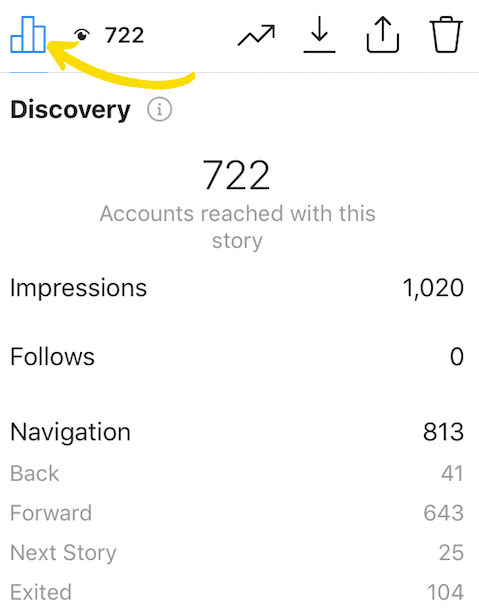
If you just want to check how a particular Story is performing, you can access its data from your Business or Creator Account in four simple steps:
- Tap on the story you’re interested in
- Swipe up
- The post will expand to show the metrics at the bottom
- Tap the (chart) icon to bring up Insights for that story
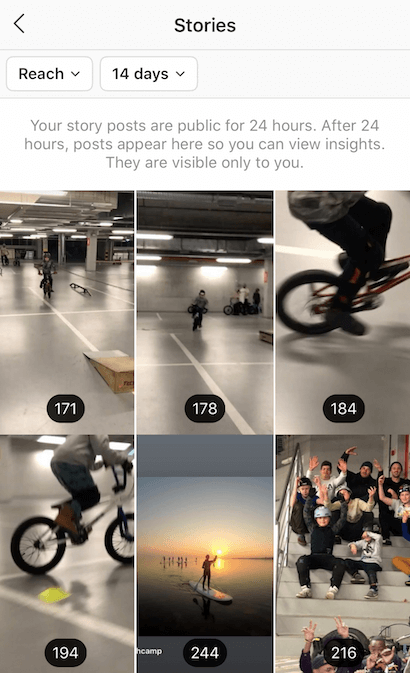
Analyse Instagram Stories from Instagram Insights
If you want to get an overview of how all of your Stories are performing or take a look at historical Stories data, you’ll need to use Instagram Insights.
- Go to your Business Profile
- Tap the Menu icon in the top right
- Select ‘Insights’
- In Insights, select the Content menu
- Scroll down to ‘Stories’
- Select ‘See All’ to view Insights for all Stories
What Stories metrics should you track?
Stories metrics fit into three categories:
- Discovery metrics
- Engagement metrics
- Navigation metrics
Discovery metrics like Impressions, Reach and Follows mean much the same as they do for other Instagram content. And, since you’re probably already familiar with them, we’ll only cover Stories-specific metrics here.
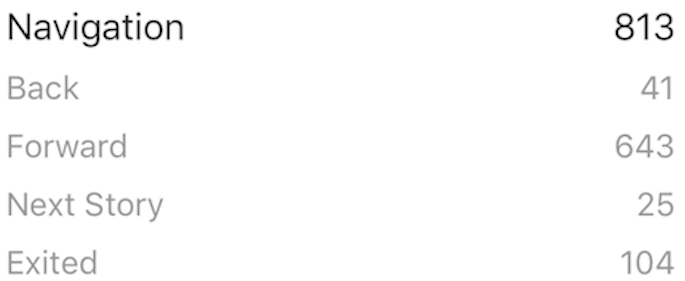
Forward
What are taps Forward in Instagram Stories?
Taps Forward is a navigation metric that indicates a user has tapped the right of their screen to skip to the next slide in your story. It isn’t necessarily negative.
What do taps Forward in Instagram Stories mean?
There are a few ways of thinking about taps Forward:
- The user wants to skip to the end of the story to find your call to action (or link/sticker/bio)
- They’re eager to see what else you have up your sleeve
- They’re just “speed tapping” their way through a lot of content
- They’re bored of your content and want to move on
Only the last of these is very negative. To address Taps Forward, think about the following:
- State your key message early on in the video, within the first 5 seconds is ideal
- Always place a CTA at the end of the video
- Showcase a wide range of Stories to keep speed-tappers engaged
Backwards
What are taps Backward in Instagram Stories?
As you might have guessed, Taps Backward is another navigation metric. It indicates that a viewer has tapped the left of their screen to rewatch previous slides or a previous story.
What do taps Backward in Instagram Stories mean?
Taps backward are generally positive because they mean a user wants to engage with your content. For example, users might tap Backwards if they:
- Were “speed tapping” and accidentally skipped content they thought looked interesting
- Were looking for a specific Story and selected the wrong one from your Profile
- Couldn’t keep up with the pace of your story and wanted to watch it again
- Watched it without sound and later realised it needed it
- Missed your poll or another clickable element because your content was too fast
These scenarios offer plenty of opportunities to optimise your Stories. You could try:
- Making the first few seconds unique and captivating to catch speed-tapper’s attention
- Adjusting the amount of content in a Story until you find a pace that performs well
- Adding a notification about sound at the start of your Story
Exits
What are Exits in Instagram Stories?
Exits is yet another navigation metric. A user Exits your Story when they:
- Tap the ‘X’ icon
- Close their Instagram app
- Swipe away from Stories to other content in Instagram
What does Exits in Instagram Stories mean?
Exits tells you when a user leaves your content. It’s another slightly ambiguous metric because, if you don’t have a defined CTA in your Story, people might exit to look up your business or products online. Equally, they might have had enough of your content or of Instagram in general. So, what should you do about it?
- Switch up your Stories content to keep it engaging
- Include Stickers to keep people interested and push a CTA

Instagram Stories analytics
Measure your Instagram marketing results. Track Instagram Stories and improve performance – with an all-in-one social media tool.
Next Story
What is Next Story in Instagram Stories?
Next Story is the last navigation metric. As the name implies, it indicates that a user has moved on to the next story. Often someone else’s content.
What does Next Story in Instagram Stories mean?
If you’re seeing a lot of Next Story’s, people might be getting bored with your Stories. Or else your content is fine, but the Stories are too long. To keep on top of it, try to stay attuned to where in your Story people are leaving. If it’s always after, say, 6 slides, you know that’s the optimum length for your audience.
Replies
What are Replies in Instagram Stories?
Replies is an engagement metric, so it indicates whether your Story was interesting enough for users to interact. But, Replies differs from Comments in that Replies are not posted publicly alongside your content. When a user Replies, it opens a private message with you.
What do Replies in Instagram Stories mean?
As with all engagement metrics, a high level of Replies means your content is doing its job of inspiring users to action. If your Replies are low, try prompting users in your content by including a specific CTA or question.
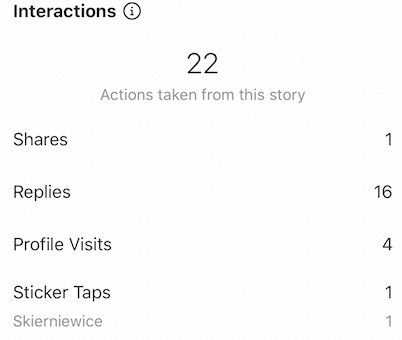
Profile Visits
What are Profile Visits in Instagram Stories?
Profile Visits indicates the number of times users have clicked through to your profile from one of your Instagram Stories.
What does Profile Visits in Instagram Stories mean?
This engagement metric shows whether or not your content and its related CTA are strong enough to inspire action. A user will only view your Profile from your Story if they want to:
- Learn more about you or your business
- Consume more of your content
- Find a way to get in touch with you
So, if your Profile Visits metric is high, your content is doing its job.
Sticker taps
What are sticker taps in Instagram Stories?
This important engagement metric indicates the number of times users have interacted with the Stickers you place in your Stories. Stickers is the generic term used to describe geotags, hashtags, mentions or product stickers.
What does Sticker Taps in Instagram Stories mean?
Sticker Taps are interactive and show you’re engaging your audience in a two-way conversation. If your Sticker Taps are high, your content is inspiring action and the Stickers you’re placing are relevant. But, if it’s low, you might want to consider:
- Adding an emoji slider sticker
- Creating a poll
- Using Stickers to ask specific, clear and relevant questions
Swipe-ups
What are Swipe-ups in Instagram Stories?
Swipe-ups is Instagram’s newest Stories metric and it’s only relevant to Instagram Business Profiles with more than 10,000 Followers because only these accounts are eligible to add links to their Stories. Swipe-ups indicate the number of times users swipe-up on a Story to Follow a link.
What do Swipe-ups in Instagram Stories mean?
If your Insights shows low Swipe-ups it could be that:
- Your link needs to be more relevant to the content
- It’s placed too late in the Story
- You don’t have a clear Swipe-up CTA

Track Stories analytics in your NapoleonCat’s social dashboard
Native Insights are really useful. But if you’re managing several social accounts, using a universal tool like NapoleonCat’s social dashboard can make tracking, analysing and reporting on your campaigns much easier.
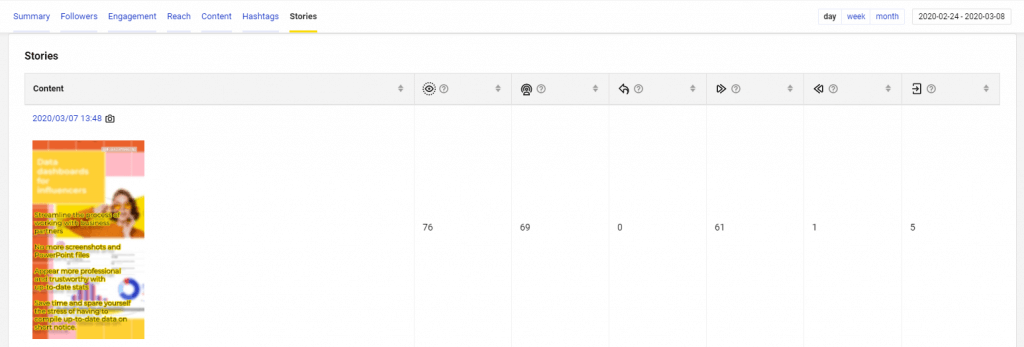
With NapoleonCat, you can compare Instagram Stories and other social activities all in one place. And use insights from different platforms to improve the efficiency and success of your approach.

Instagram analytics & reports
Access detailed Instagram analytics. Generate Instagram reports for your own accounts and for your competitors' profiles, too – with an all-in-one social media tool.
The takeaway
Short-form video content has been the unexpected star of the last four years of social media. And the trend shows no sign of slowing. So it’s more important than ever to understand how to use it to your advantage, to market your business and reach the right people to grow.
You may also like:
- How to Analyze Competitors on Social Media
- Top 10 Social Media Analytics Tools for Teams
- Find Your Best Times to Post on Social Media
- The Ultimate Facebook Analytics Tool
- Case Study: Using Social Media Analytics to Build Solid Engagement for an eCommerce Brand
- Answers to 15 Common Questions About Instagram Analytics
- Understand Instagram Analytics (Insights)
- Get The Most Out Of LinkedIn Analytics
- A Beginner’s Guide to Twitter Analytics
- What Is a Social Media SWOT Analysis?
- Social Media Audit: Step-By-Step Guide