Save hours on social, every day.
Automate moderation and replies, schedule posts, and pull reports - all in one tool.
Need to create a LinkedIn analytics report but hate the very thought of it? Here are some ways to do it quickly and efficiently, without spending hours working on Excel spreadsheets every week, month, or quarter.
Create LinkedIn analytics reports within seconds
Generate custom LinkedIn reports within seconds. Schedule automatic reports and more – with an all-in-one social media tool.
Why even create LinkedIn reports
Regular LinkedIn reporting might seem like an extra (and sometimes daunting) task, especially if you’re already balancing a full plate of responsibilities. And if you’re a social media manager, your plate is overflowing.
Regular LinkedIn reports, though, can be important tools to help showcase the effectiveness of your presence on LinkedIn (and, essentially, your day-to-day work). So, if you really don’t enjoy creating reports, here’s why you should.
(And in a minute, I’ll show you how to automate the process, so it’s no longer that daunting task but something that literally takes a few clicks.)
Valuable insights
LinkedIn reports offer data on your network and content performance, helping gauge the effectiveness of your LinkedIn strategy, whether that’s a social media marketing and sales strategy or your employer branding and recruitment strategy.
You can’t improve what you can’t measure, after all, so taking a regular look at what works and what doesn’t helps you figure out what moves to make next.
Reports can also uncover trends, such as high engagement with specific content types, allowing for strategic pivots and improvements.
Optimizing your brand presence
By analyzing metrics like engagement rates and profile views, you can refine your approach to attract the right audience and connections. And being regular about it helps you see trends and react quickly when they change.
And yes, you can also do it by just checking your analytics every Friday. But creating a report lets you easily share that knowledge with others and get a clear image to, well, report to whoever’s interested.
Tracking business impact
A LinkedIn analytics report obviously helps you track the success of your marketing and recruitment efforts. This way, you can reach your target audience effectively and optimize the ROI from your LinkedIn activities, whether they’re sales campaigns, thought-leadership building, or employer branding, and compare it with other channels.
Accountability and transparency
A regular review of your LinkedIn reports helps build a data-driven culture in the company. And this helps make evidence-based decisions and align teams based on specific information and goals.
Getting leadership buy-in
Let’s face it – this is probably the most important one. Regular reports help you show the effectiveness of what you do on LinkedIn, and justify the expenses (and maybe the budget increase you’ve been asking for.) Plus, they can be an important tool for you during that next performance review conversation with your boss (or your client if you work for an agency.)

Manage multiple LinkedIn accounts from one place
Manage all your LinkedIn comments and conversations from one view. Schedule LinkedIn posts and get in-depth analytics reports to improve your strategy – with an all-in-one social media tool.
Key metrics to include in your report

In a nutshell – you should always include the metrics that are actually relevant to your business or a marketing or recruitment initiative you’re tracking. Having said that, there are some universal metrics almost everyone will want to know, and that can show the effectiveness of your content and campaigns on LinkedIn.
So, while it’s not a complete LinkedIn analytics report template, the following are some of the metrics you should consider tracking and including in your reports.
Company page views
Tracking your page views will reflect your brand visibility and interest in your company. This metric can also indicate the success of your content in attracting and retaining followers. A drop might suggest that your page information and/or content strategy need optimization.
Follower growth
Tracking the growth of your LinkedIn page followers over time helps you measure the effectiveness of your outreach efforts. If your content is relevant and keeps getting discovered by new people who want to see more of it, your follower growth will reflect this.
And when that number is stuck for a longer time, you need to find new ways to help get the word out, attract your target audience, and let them know why it’s worth following you.
Post views
This tells you how many people have seen your posts, and it’s a key indicator of the reach of your content and whether it’s resonating with your audience. In general, the LinkedIn algorithm is not super favorable for company page content, so finding ways to spread the news – for example, by resharing posts on personal employee profiles – is really important.
Engagement rate
Engagement on LinkedIn includes likes, comments, and shares on your posts. A high engagement rate means you’re doing things right and your content is relevant and valuable to your audience. When it drops, you may want to take a closer look at the content strategy and how to improve it.
Follower demographics
Understanding the demographics of your followers, for example, their location, industry, and job function can help tailor your content and job postings to better target your audience. It will also show you whether you’re indeed attracting the people you want to attract with your content, messages, and ads.
Click-through rate (CTR)
If your goal for LinkedIn is to drive traffic to places outside of the platform, like your website or external job boards, tracking link clicks will make sense – maybe more than, for example, follower growth.
InMail response rate
We’ve all been on the receiving end of unwanted messages in our LinkedIn inboxes. So, if you send InMails – whether as part of your cold sales outreach or recruitment strategy – tracking their effectiveness is key in tailoring your content to be relevant and compelling. And not let you be that person to send messages nobody wants to read. 👀
How to generate a LinkedIn analytics report on LinkedIn
One way to generate a LinkedIn analytics report is by using the native analytics tools LinkedIn gives you, accessible to all page admins.
You can access your LinkedIn Company Page analytics in the left-hand menu:
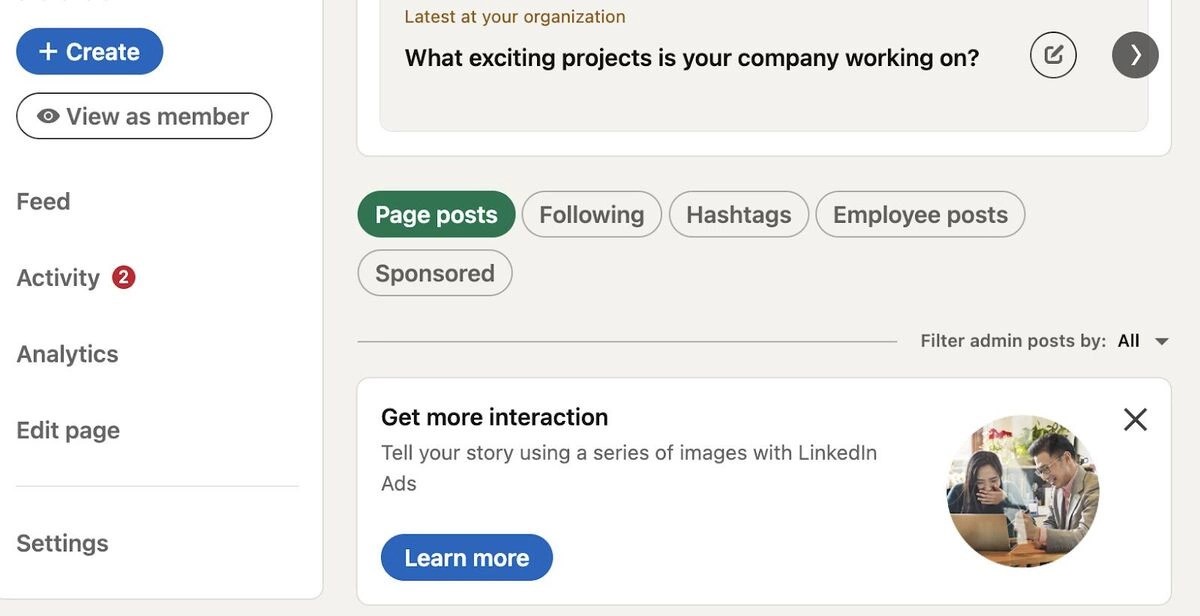
When you click on it, you can access all the numbers in your LinkedIn dashboard over time. Here’s a quick look at all of them.
Content
The content tab gives you the following content-related metrics on a timeline:
- Impressions
- Unique impressions
- Number of clicks
- Reactions
- Comments
- Reposts
- Engagement rate
You can also select organic and sponsored content to see the results, and you’ll see content engagement for individual posts, too, updated in real time.
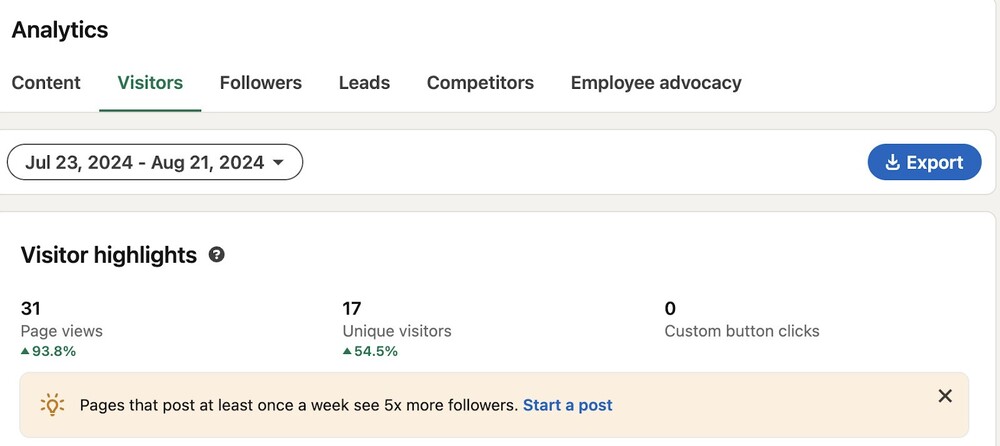
Visitors
The Visitors tab includes details about the number of page views and the number of unique visitors, on desktop and mobile.
You can also differentiate between the pages of your LinkedIn Company Page, including:
- Home
- About
- Insights
- People
LinkedIn also displays your visitor demographic details, such as:
- Job function
- Company size
- Industry
- Location
- Seniority
Followers
The LinkedIn analytics tool also gives you a rundown of all your followers, including whether they came from organic sources or sponsored content on LinkedIn.
In this tab, you can also see who they actually are and their demographic data, including the same data you can check for your page visitors.
Leads
The leads tab will show you data associated with your LinkedIn lead gen forms if you’re currently using them. Lead gen forms let you collect leads on your LinkedIn Company Page, and this tab will show you all the results and will also let you download your leads information.
Depending on the fields in your lead gen form, you can collect data including:
- Contact details
- Work
- Company
- Education
- Demographics
Competitors
The native LinkedIn analytics tool also lets you track benchmarks for your LinkedIn marketing strategy. You can add competitor pages (up to 9 pages total) and then track how you compare in terms of LinkedIn metrics like:
- Follower growth
- Content engagement
- Trending posts
Employee advocacy
If you have people whose LinkedIn accounts are connected to your Company Page as employees, you’ll also see their activity related to your page. This includes:
- Recommendations
- Posts from recommendations
- Reactions to your page posts
- Comments to your page posts
- Reposts by employees
Now, to generate your LinkedIn analytics report, you can export most of the data into .XLS or .CSV files, selecting a time range, for example, the previous month.
To do that, you click “Export” on the selected tab.
But it’s still a LinkedIn analytics export and not a proper, user-friendly analytics report. And you have to export the data separately from the different tabs – which means you’ll need to put them together into your selected format, anyway.
This is really the main shortcoming of using this way of generating LinkedIn reports because it doesn’t really make your work a whole lot easier.
How to generate a LinkedIn analytics report in NapoleonCat
If you want to save time and not have to deal with spreadsheets, generating a LinkedIn Analytics report in NapoleonCat is the way to go:
- You can easily generate reports by selecting the relevant metrics you want to include.
- And then the report gets generated automatically for you – as a nice-looking PDF, with your logo on it if you want, and visualized data that’s not just spreadsheet numbers.
- You can even schedule your LinkedIn Analytics report to get automatically generated in a selected time frame, for example, every week or month, and sent straight to your inbox and the inboxes of all the people who need to see it.
NapoleonCat offers both in-app analytics dashboards and LinkedIn analytics reports. And here’s how to generate a LinkedIn analytics report.
1. Go to the Reports tab in the left-hand menu in NapoleonCat:
2. Click “Create new report”
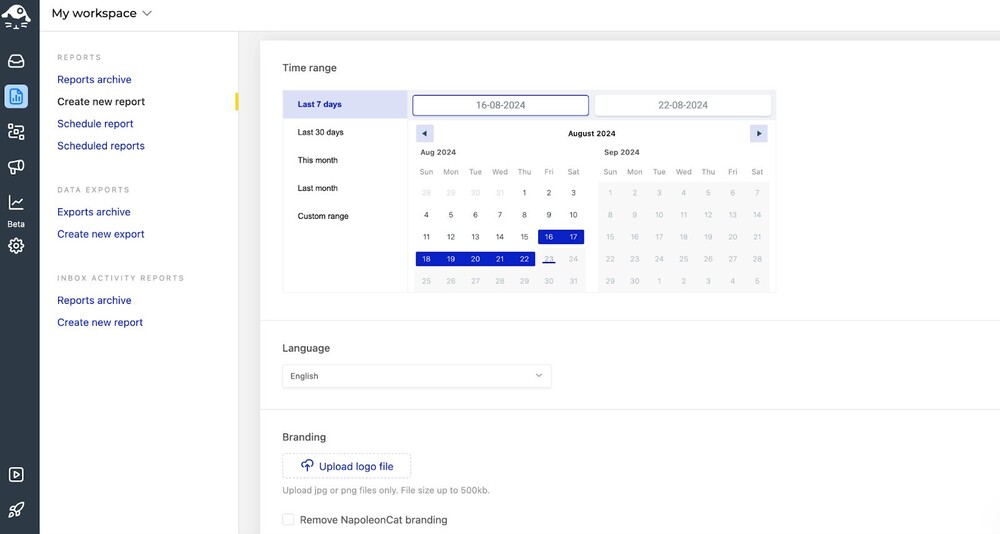
3. Then set up all the details you need for the report:
- Time range
- Language
- Your branding
- And select your LinkedIn profile
4. Then, select the metrics you want to include in your report from the available ones below:
- Key performance indicators
- Mentions
- Post impressions
- Post list
- Follower growth
- Views by country
- Engagement rate daily
- Page impressions
- Interactions
- LinkedIn Engagement Rate
5. Then, click “Generate” and wait for your report to come together. It will take a little while for the system to crunch all the data and create your report pages – which might look like this:
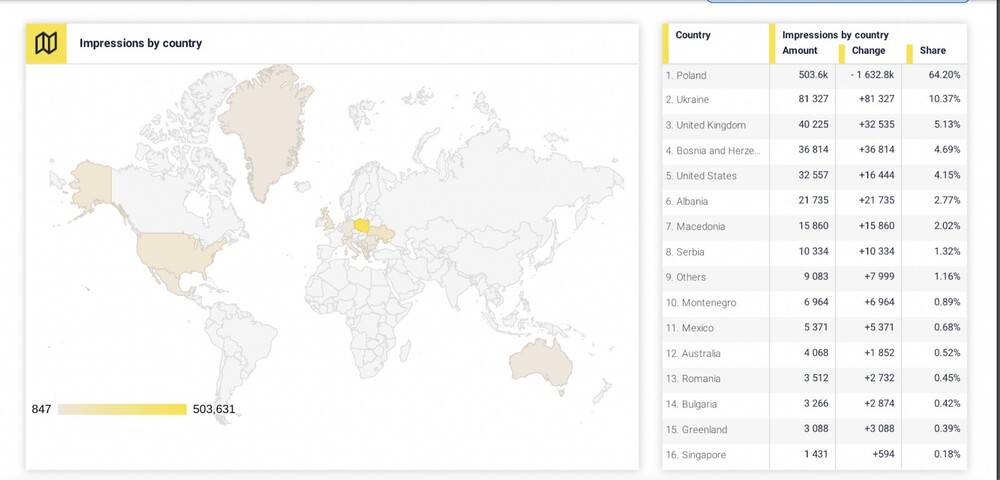
Or this:
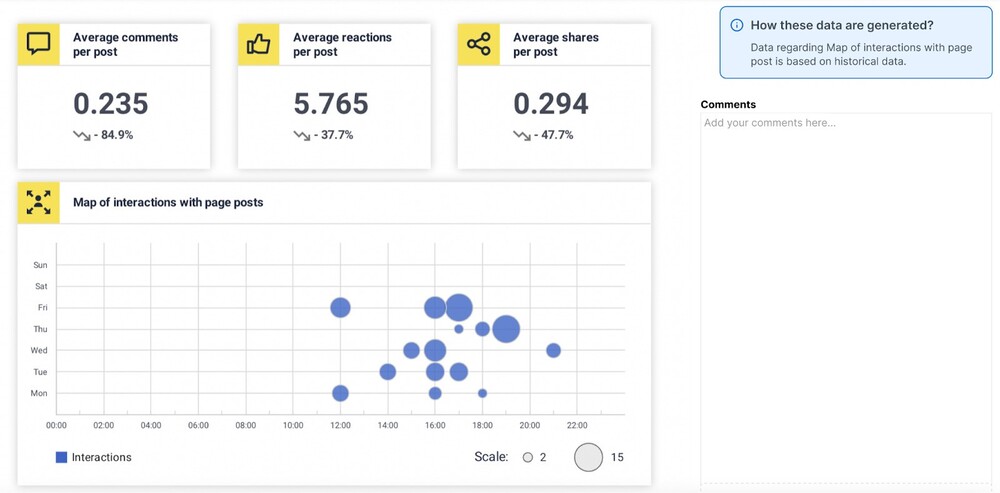
6. You can then download the report, send it to other team members or your client, and use it in any other content you need it for.
Scheduling a recurring LinkedIn analytics report in NapoleonCat
You can also schedule a recurring LinkedIn report to be automatically generated and sent to the email addresses you selected. Here’s how to do that:
- In the Reports tab in NapoleonCat, click “Schedule report”
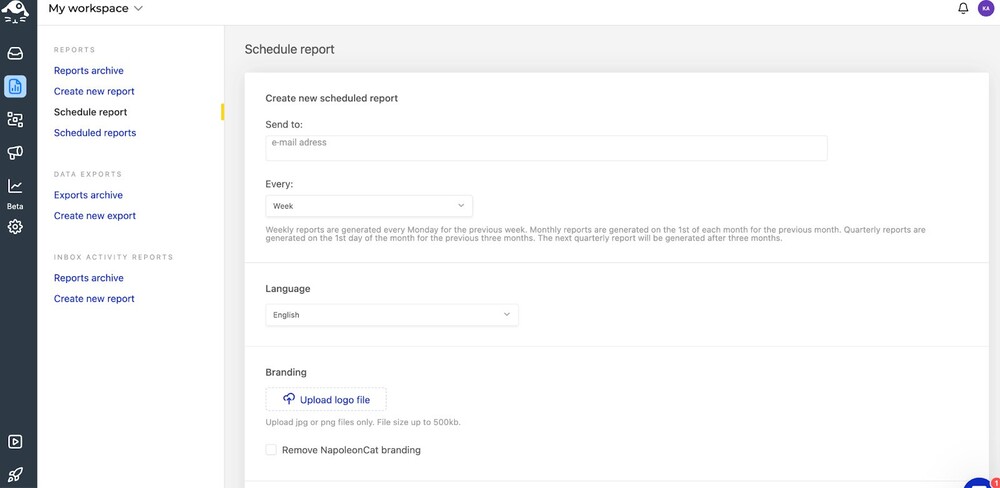
- Add the email address you want the report to be sent to and select the frequency. You can generate a report weekly, monthly, and quarterly.
- Follow the same steps and generate the report.
- You can check your scheduled reports in the “Scheduled reports” tab.
- Every week/month/quarter, the report will be generated and sent to the email address you added. Without you clicking another button, sending another email, or even using a LinkedIn analytics report template.
We also made a how-to video that you can see below 😉
Wait, there’s even more to make your life easier
Besides offering the LinkedIn analytics reporting tool, NapoleonCat has many more LinkedIn management tools for business you can use to:
- Track the performance of competitor LinkedIn pages and compare it with your performance
- Generate and schedule social media analytics reports for other platforms, including Facebook and Instagram.
- Schedule and automatically publish LinkedIn content in a shared content calendar – alongside other social media channels, like Facebook, Instagram, TikTok, Google My Business, and now also X (Twitter).
- Engage with your commenters in one dashboard and reply to their LinkedIn comments – even when you manage multiple LinkedIn company pages.
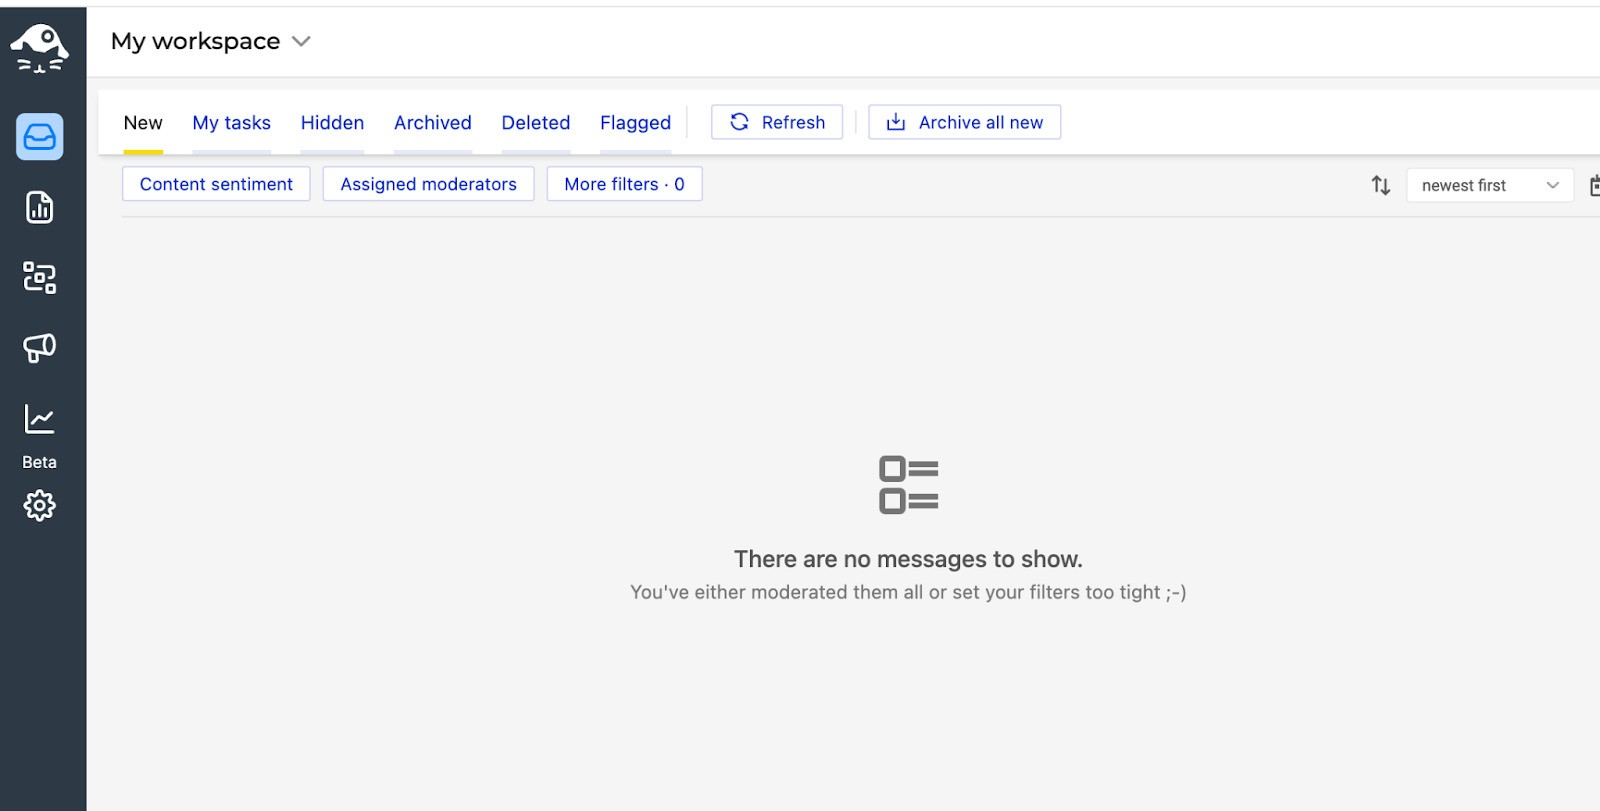
And recently we expanded our Auto-Moderation feature to include LinkedIn, allowing you to:
- Set up multiple automated replies to frequently asked questions (such as “Is this job offer still available?” or “What services do you offer?”) based on keywords,
- Automatically hide/delete spam and hate from your content,
- Automatically flag and tag comments,
- Automatically assign a comment to a moderator on your team.
Manage multiple LinkedIn accounts from one place
Manage all your LinkedIn comments and conversations from one view. Schedule LinkedIn posts and get in-depth analytics reports to improve your strategy – with an all-in-one social media tool.
We highly recommend you test NapoleonCat completely for free – no credit card required 😉
To report or not to report?
Obviously, report for all the benefits I mentioned at the beginning of this article. But also – do it in a smart way with NapoleonCat, with minimum effort and nice-looking results that will help you impress your boss at that next performance review meeting.
You may also like:
- Creating Facebook and Instagram Analytics Reports: A Guide
- How to Create an Instagram Analytics Report
- How to Create a Facebook Analytics Report (in under 1 minute)
- LinkedIn Analytics – The Ultimate Guide
- The Easiest Way to Create a Weekly Social Media Report
- How to Create a Monthly Social Media Report (in under 1 minute)
- What’s The Best Time to Post on LinkedIn?