
Save hours on social, every day.
Automate moderation and replies, schedule posts, and pull reports - all in one tool.
Table of Contents
- Steps to creating a weekly social media report
-
Tracking KPIs
- Adjust your social media strategy based on KPIs
- How to create a weekly social media report (in 1 minute!)
- Do a competitive analysis by generating social media reports for competitors’ social profiles
- Generate a report to measure your team’s performance
- Final Word
More than half of the world’s population uses social media. Going with that statistic alone, you’d be remiss not to use social media to acquire customers and grow your brand.
The problem? Proving the ROI of social media marketing can be a little tricky. Sure, you’re getting likes and shares. But will that translate to revenue?
If you’re struggling to justify spending time and money on platforms that rely mostly on ambiguous metrics, wait till you’re tasked to convince a client, boss, or stakeholder that your efforts on social media are generating ROI for the brand?
Thankfully, it’s not that hard. All you need is to send them a weekly social media report.
- Steps to creating a weekly social media report
-
Tracking KPIs
- Adjust your social media strategy based on KPIs
- How to create a weekly social media report (in 1 minute!)
- Do a competitive analysis by generating social media reports for competitors’ social profiles
- Generate a report to measure your team’s performance
- Final Word

Social Media Reports & Analytics
Generate in-depth social media reports in seconds – for Facebook, Instagram, and LinkedIn. Schedule weekly, monthly, or quarterly reports for your own accounts and your competitors, too – with an all-in-one social media tool.
What is a social media report?
A social media report is a document that showcases essential data regarding your social media activities. It can take numerous forms, from a simplistic list of numbers in a spreadsheet to a marvelous slide presentation filled with observations and insights.
In other words, a social media report helps you (and by extension your clients, bosses, and stakeholders) make sense of your social media activities. It helps answer the burning question: “Is my social media marketing working?”
Here are the things a social media report can do:
- Define your social media strategy and goals
- Let you know where you are in your social media overall goals
- Prove the ROI of your social media campaigns
- Highlight the successes of a social media campaign so you can keep repeating them
- Help you figure out what’s not working (and how you can address those failures)
- Unlock insights or opportunities for improving or growing your brand
- Benchmark your brand’s social media presence or current metrics against competitors
- Help you get that elusive promotion or keep your job (haha)
Steps to creating a weekly social media report
How do you create weekly social media reports that will impress your boss or clients?

Follow these steps:
1. Define your goals
Why are you creating a social media report in the first place? Define the social media report’s objective and goals so recipients can easily make sense of the KPIs presented there. That way they can see clearly the brand’s current position based on the data and insights contained in the report, and give them a clear sense of the direction the brand needs to take.
2. Identify the recipient/s
Who are the stakeholders? How will the report benefit them? By identifying the target audience you can create a social media report that provides metrics and insights that are relevant to them.
3. Determine the time frame
Will it be weekly, monthly, or quarterly?
Determining the time frame lets you know which data and KPIs are relevant, and gives you a frame of reference as to how that information and the insights generated from it will impact your broader marketing goals. Moreover, it gives you the context you need on how you want to move forward in your social media marketing efforts.
4. Define the metrics you want to include
After examining the report’s goals, its recipients, and time frame, you’ll get a good grasp of which KPIs are pertinent to your purpose and objectives (more on social media KPIs in the next section!). Make sure to check the company’s stage of growth and identify lagging and growth indicators.
5 Organize the report
Now that you’ve picked your KPIs, you need to make sense of the data and present the unlocked insights in a context your target audience will easily understand.
Make sure that you don’t overwhelm the recipient with unnecessary data. Only put in there the data that’s relevant to your goals. And don’t forget to add great visuals. The goal here is to provide more context to the numbers and ensure they form a narrative that sheds light on your brand’s current position as a social media presence and the direction it needs to take.
5. Add recommendations
What are your key takeaways from the report? What are your recommendations? While your recipients can make up their own minds, adding your insights and recommendations on top of what’s already in the report can give them the additional context they need to make an informed decision (and for your social media team to get an executive buy-in).

Easily create weekly social media reports
Create (or schedule) weekly social media reports in seconds. Generate reports for your own profiles and your competitors' – with an all-in-one social media tool.
Tracking the KPIs of your weekly social media report
Choosing the right KPIs is key to an effective and actionable weekly social media report. After all, the right sets of data presented in the right way can unlock invaluable insights to help carve the right path for a brand.
Notice how many times I used the word “right” in the previous sentence? This only goes to show that choosing the right KPIs is something you need to get right when creating a social media report.
The KPIs you need to include depend on the goals of your social media report. But here are the essential KPIs you most likely need to include:
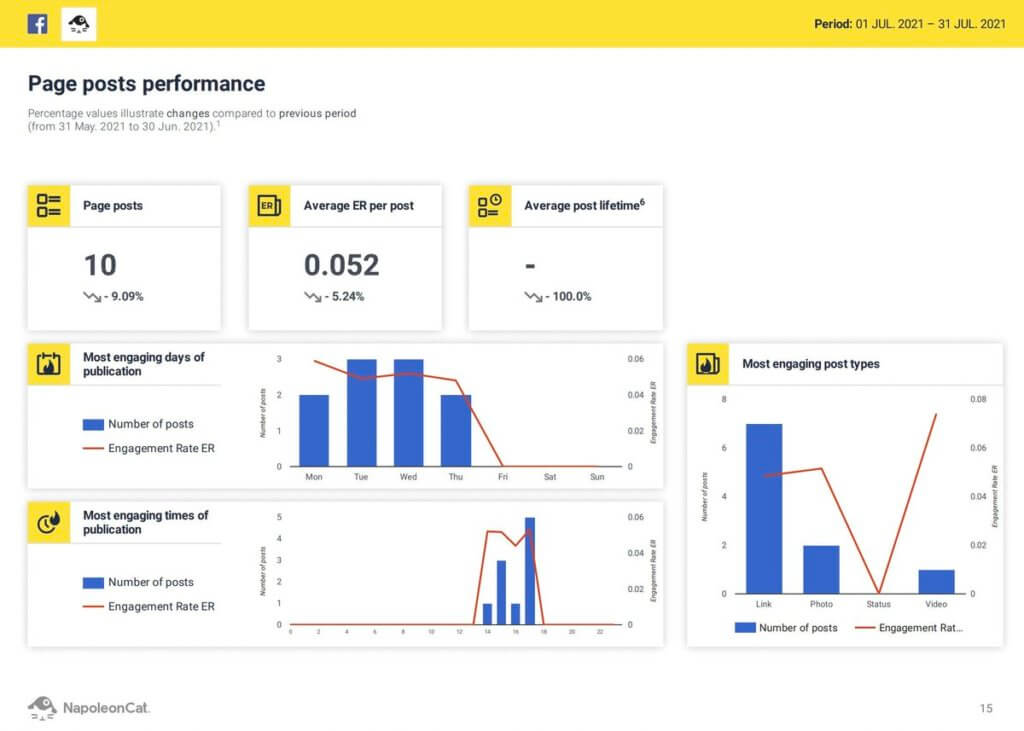
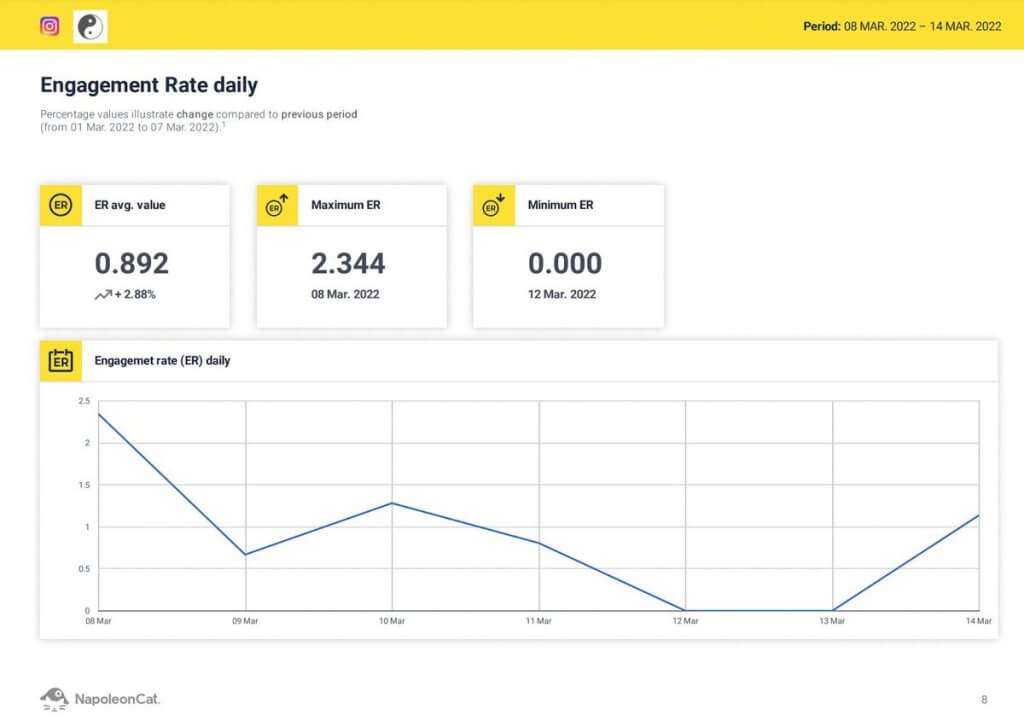
Engagement
How often do your users interact with your brand on social media? This is an important measure of whether your social media content is resonating with your audience. After all, the more engaged they are, the more invested they are in your brand, and the more likely they are to buy. Engagement metrics include the number of likes, comments, shares (or retweets), or clicks.
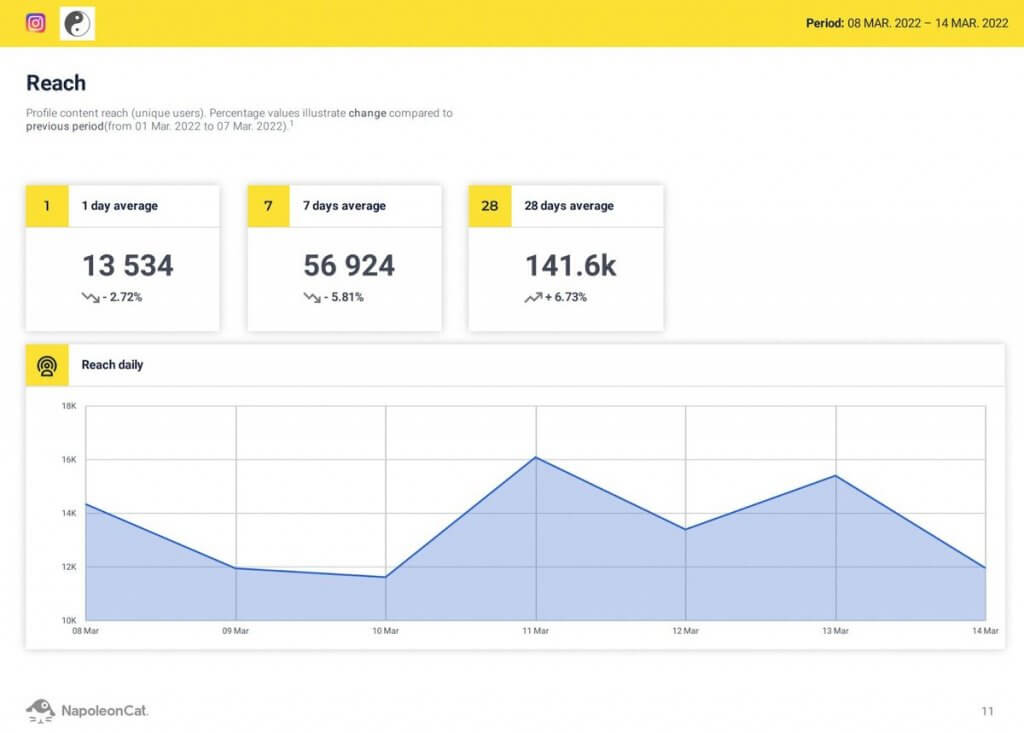
Reach
Reach is the number of unique users who have seen your social media content (as opposed to the raw number of views your social media content is getting). Tracking reach is important because it helps you find out how many potential leads or potential customers your content is generating.
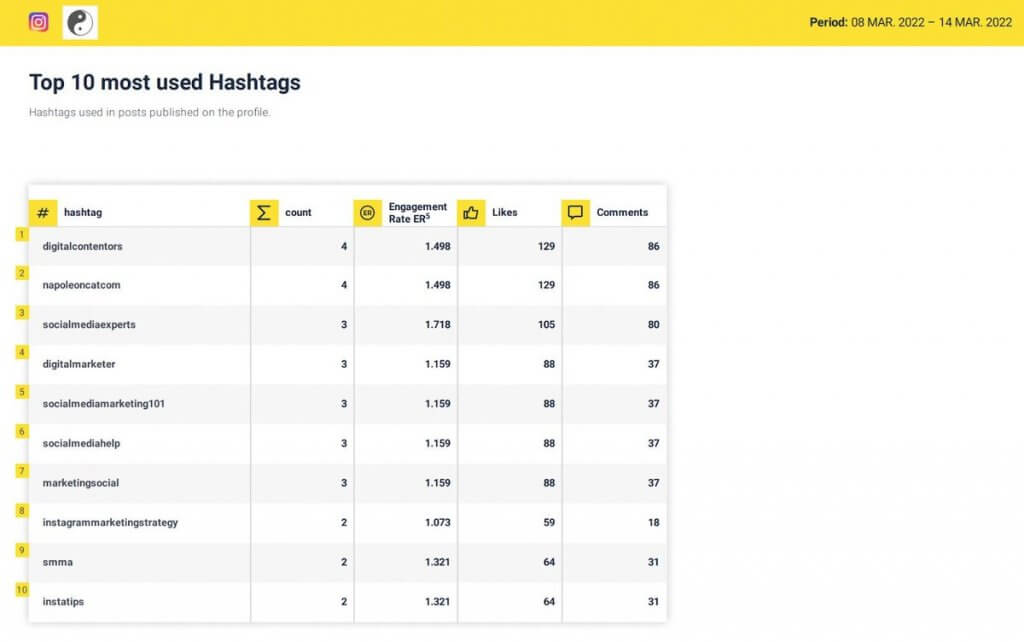
Hashtags
Hashtags let you know what people are talking about, which topics are trending, and how effective your campaigns are. Tracking your hashtag performance is an excellent way to evaluate your brand reach and engagement.
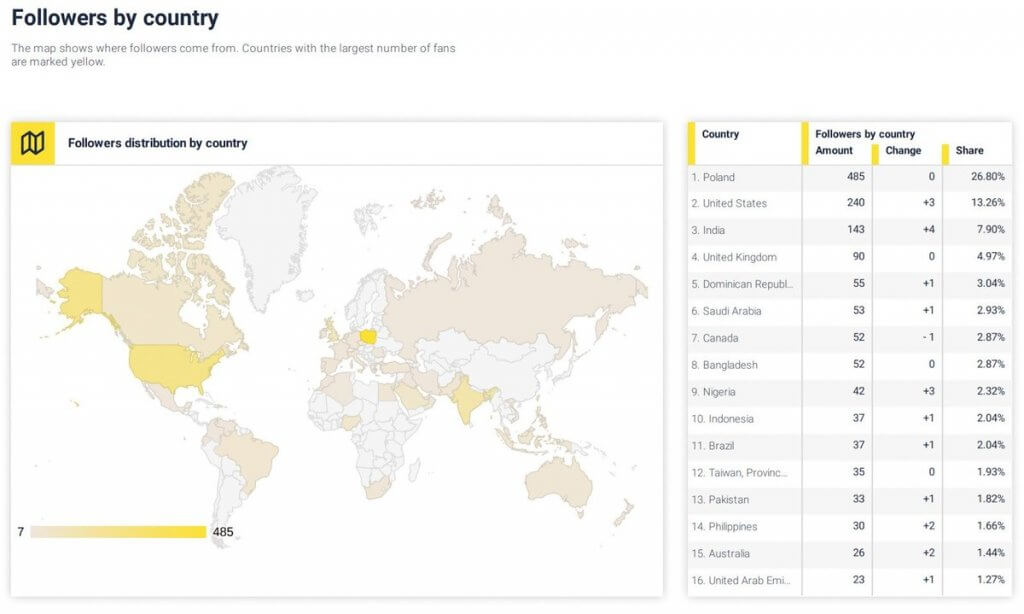
Demographic data
Demographic data is information about your audience based on attributes such as age, gender, ethnicity, income, and more. By tracking and measuring this data, it becomes clear to you which segments of your audience are engaged with your brand or why your social media content is getting little engagement. Moreover, demographic data helps you inform and enrich your personas, allowing you to tailor your content for better results.

Automate your social media reports & kick back 😉
Schedule weekly, monthly, or quarterly social media reports. Automate report delivery to your clients – with an all-in-one social media tool.
Adjust your social media strategy based on KPIs
As you analyze and evaluate your social media KPIs, you’ll get a good idea of what works and what doesn’t in your social media campaign, and more importantly, how you can improve it.
The insights you generate from your KPIs will have an influence on three things:
- The platforms you’re using
- The types of social media content you’re publishing
- And the best times to post
For the above three, it helps to examine all data across the board, and not come to any conclusion when looking at each KPI in isolation. You need to cross-reference your data to unlock insights that will help you discover the best way forward.
For example, if your social media content is low on engagement, you may want to check other data on why that is.
Is it because your posts are too generic? Or maybe you’re catering to a younger audience and the content could resonate better using a short-video format? Or maybe your posts (or tweets) are too similar and it’s time to diversify?
You’ll encounter many scenarios like this when creating a social media report. To discover the best way forward, you need to cross-reference your data to get a more nuanced understanding of why your KPIs are the way they are.
What to post on each social media platform to stand out
Here’s a breakdown of the different social media platforms and the recommended types of content for each to help inform your decision while analyzing your social media KPIs:
- Facebook. The types of content that resonate on Facebook include inspirational and educational content. Instructional video content, how-to guides, and curated content from news sites or industry partners do very well on this platform.
- Instagram. Instagram is a highly visual platform (unsurprisingly). But don’t just publish high-quality photos, publish the ones that tell a great story and humanize your brand. Publishing exclusive behind-the-scenes content via Stories is a great way to build affinity for your brand. User-generated content (UGC) also does well on Instagram.
- LinkedIn. LinkedIn is a professional networking platform designed for career development, networking, and business connections. The content that performs best on LinkedIn is job-related: industry insights/trends, professional updates, career tips and advice.
How often should you post on social media?
For your social media marketing to gain traction over time, you need to publish regularly. But publish too often, and your followers will end up overwhelmed, causing them to unfollow you.
Post too few, and you’re not putting your brand out there enough to gain a social media presence.
Thankfully, there’s research by CoSchedule showing how often you should publish for different networks.
Our simple take? Don’t publish for the sake of publishing. Post as often as you’re able to create great content and focus instead on the best times to post for each social media platform.
How to create a weekly social media report (in 1 minute!)
Creating a weekly social media report can be overwhelming. But you don’t have to go through all that trouble.
With NapoleonCat’s social media analytics tool, you can:
- Generate in-depth reports for your profiles on FB, IG, and LinkedIn
- Generate reports for your competitors’ profiles
- Generate one Facebook report for up to 8 Facebook Pages
- Analyze completely custom periods
- Schedule and automatically generate your social media reports (weekly, monthly, or quarterly)
And all it takes is one minute (or less).
You can test the tool for free here, no credit card required during signup 😉
Creating a weekly social media report in NapoleonCat.
To create a weekly social media report in NapoleonCat, follow these steps:
- Click on the Reports feature in the menu on the left-hand side.
- Select the “Create new report” option and then select the period for which you want to generate a report. For instance, if you want to generate a weekly social media report, pick the “Last 7 days” option.
- You also have the option to upload your own logo and remove the NapoleonCat branding from the report.
- Under “select profiles,” you can select from the three different social media platforms and pick the social media profiles you want to review.
- You can then select the metrics you want to include in the report. All metrics are pre-selected by default.
- Hit the “Generate” button on the lower right.
- You get taken to the “Reports archive” section. Once the status is completed (which takes around one minute), you’ll get an email with a link to download the report. You can download it straight from the “reports archive” section if you prefer by clicking on the download icon.
Want to generate a report similar to the one you just created? Select the “Create similar” option, change the period the report will cover, and you’re done!
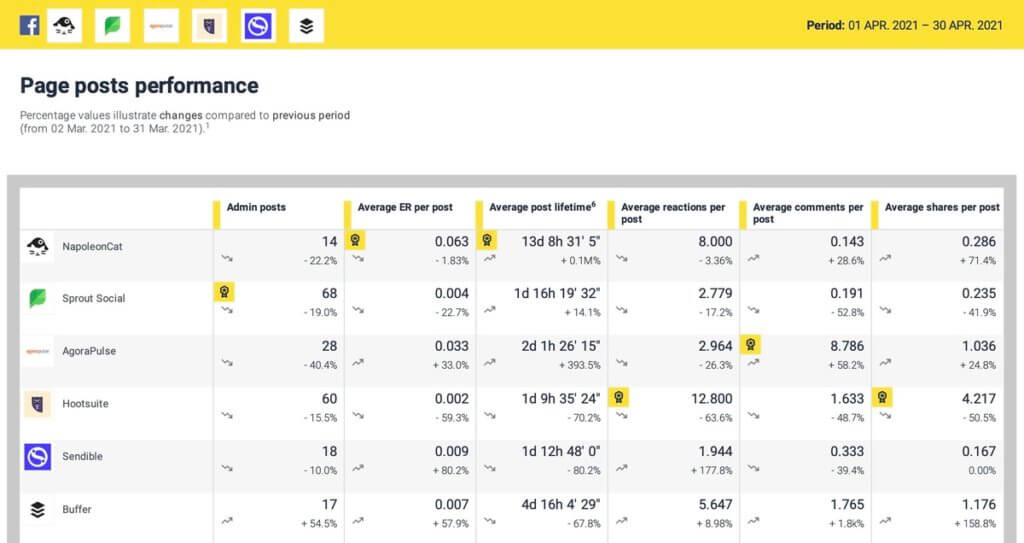
Do a competitive analysis by generating social media reports for competitors’ social profiles
Generating weekly social media reports for your competitors’ social profiles is as easy as generating one for your own profiles.
This is a good strategy especially if you share a similar target audience. Which content of theirs performs best? What are their weak spots? Can you identify content gaps you can fill?
Gather your data and then benchmark your profiles’ reports against theirs and unlock insights that will help your brand stand out on social media.
To see how to generate a social media report for a competitor’s Instagram profile, watch this video.
Generate a report to measure your team’s performance
How your team deals with incoming communication requires the same level of care as your social media marketing strategy. With NapoleonCat, you can generate Inbox Activity Reports to track and measure your team’s progress.
To see how that works, click on this guide. And to learn more about NapoleonCat’s team collaboration features, visit this page.

In-depth Social Media Analytics Reports
Create Social Media analytics reports in seconds. Schedule and automate report delivery. Analyze your own accounts and your competitors, too – with an all-in-one social media tool.
Final Word
You already know how important it is for a brand to have a presence on social media. But to convince your client or boss that your efforts on social media are generating ROI for the brand, you need more than data.
You need data with context. And the best way to communicate that context is to send them a weekly social media report. The best part? You can generate one in under a minute, giving you more time to focus on generating insights that will wow your brand’s stakeholders and earn the buy-in your brand needs.
We highly recommend you test NapoleonCat completely for free here, no credit card required during signup 😉 Good luck!
Check out our other articles about social media reporting & analytics:
- How to Create an Instagram Analytics Report
- Top 10 Social Media Analytics Tools for Teams
- How to Create a Monthly Social Media Report (in under 1 minute)
- How to Create a Facebook Analytics Report (in under 1 minute)
- Creating Facebook and Instagram Analytics Reports: A Guide
- Your Guide to LinkedIn Analytics Reports