
Save hours on social, every day.
Automate moderation and replies, schedule posts, and pull reports - all in one tool.
Table of Contents
- What is a social media report?
- Who even needs reports?
- What to include in a social media report
- Competitive reports, a.k.a. why you should also monitor your competition
- How to create a social media report in 1 minute
- Social media reporting tools to make the job easier
- Social media reports that take hours? No, thank you.
If you hate creating social media reports, but it’s part of your job as a social media manager or business owner, I hear you. Also: there’s a better, easier, and more enjoyable way to create your reports as frequently as you need them. Let me show you how it’s done.
- What is a social media report?
- Who even needs reports?
- What to include in a social media report
- Competitive reports, a.k.a. why you should also monitor your competition
- How to create a social media report in 1 minute
- Social media reporting tools to make the job easier
- Social media reports that take hours? No, thank you.

Create in-depth social media reports in seconds
Analyze your own profiles & your competitors. Generate in-depth reports for Facebook, Instagram, and LinkedIn – with an all-in-one social media tool.
What is a social media report?
(You know this section is here for SEO, now, I’ll be honest with you. But in case you really want to know.)
Does your social media content actually work? Does it move the needle for your business?
Do people enjoy what your company posts on social media? And does that help you build your brand?
What’s the best time to post content on social media for your audience? And what types of posts (and, more generally, type of content) work best?
All those questions – and more – can and should be answered in your social media reports. Because reports are a way to keep your finger on the pulse of how your social media strategy is executed and how that affects your overall marketing and your entire business. Because, as social media marketers, we all do social media for a reason, right?
So, it’s a really good idea to check if those reasons are still valid every month or quarter – and make necessary adjustments if something we assumed would work turns out not to.
Not just to look at some good-looking numbers (a.k.a. vanity metrics) and nicely designed graphs. But to see whether your marketing budget is actually spent well and to find valuable insights you can act on in the future.
And you should be able to tell all of it (and more) from a well-constructed, reader-friendly social media report.
Who even needs reports?
Your client (if you’re an agency or a freelancer.)
Your boss.
Your CMO (who might also be your boss.)
The so-called stakeholders – you know, the people who have some sort of interest in how your business performs on social media. Like your marketing team, for one.
You, if you want to be able to improve your social media performance, know what gets your audience engaged and what potentially works for your business.
Yes, we all sometimes need a report. But many of us hate making them (am I right?)
No worries, there are ways to automate the process, making it easy, quick, and Excel-free if you’re into that sort of thing.
Let’s have a look at how that’s done.
But first…
What to include in a social media report
That will, of course, depend on the purpose of the report (which, by the way, is a good idea to define before you actually create it.) And who you’re preparing it for.
But a good rule of thumb is to – guess what – include data that’s truly useful and relevant. Yes, it’s nice to impress your client with the incredible follower growth in the last 6 months. But let’s not forget the context and what that actually means for your client’s business (not to mention whether those new followers are indeed potential customers.)
Let’s take a look at what you can include in your social media report:
- Follower growth over time
- The reach of your content
- Daily audience interactions
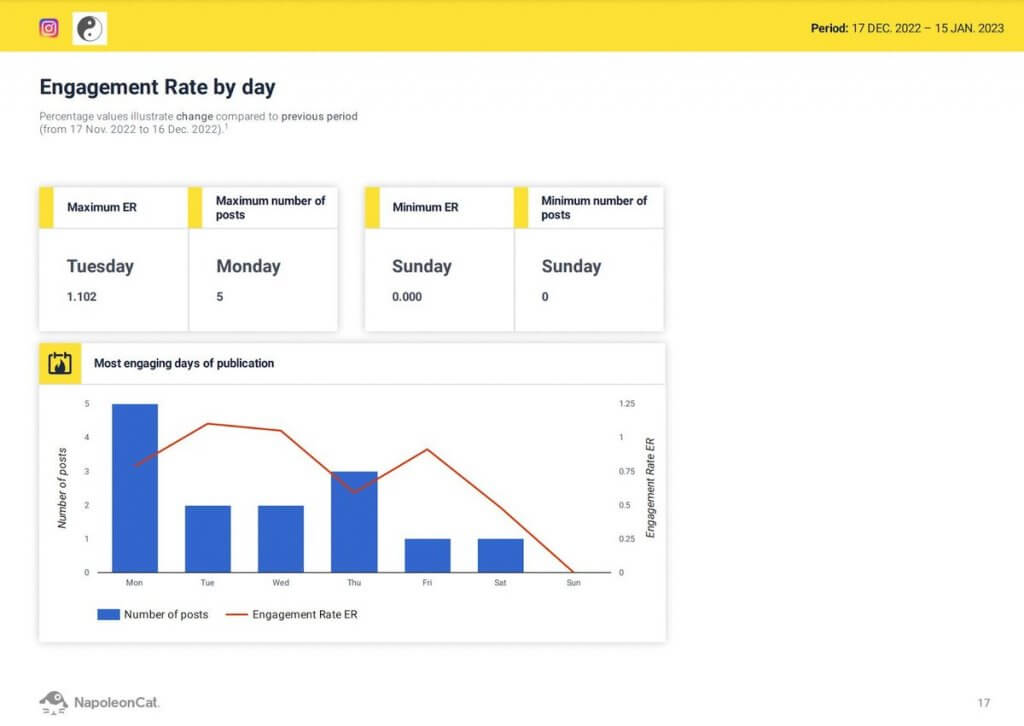
- Engagement rate – daily and hourly (that’s where you’ll get your best times to post on social media)
- Top performing posts, including most liked, commented, or viewed content
- Follower demographics – including country, city, gender, and age
- And more
And let’s not forget these will be slightly different for different social media platforms. And comparing different social accounts side by side will also give you an idea of which platforms work best for your business and your audience and where to intensify your marketing efforts (and your budget.)
A social media report can also give you insights into your team’s activity, including:
- How often they post on your profiles
- And how quick and efficient they are in responding to customers on social media.
This will help you take a closer look at your social media customer service and what you can do to improve your customers’ experience with your brand on social.
Social media analytics reports for FB, IG, and LinkedIn
Showcase your results with comprehensive social media reports. Automate report delivery to keep your team, clients, and stakeholders in the loop. Make data-informed adjustments to your strategy – with an all-in-one social media tool.
Competitive reports, a.k.a. why you should also monitor your competition
Now, the metrics for your social media channels are essential, but they’re just part of the puzzle. What your competitors do and how you compare will help complete the picture and create benchmarks you know you’re competing against, and define your social media KPIs.
With tools like NapoleonCat, you can dig into the social media stats for your competitors’ profiles and compare them side by side with your brand’s social media channels. A handy tool to compare social media growth and engagement and come up with new, more effective tactics.
Here’s more about how to analyze your competitors on social media.
And here’s an example of how to create a competitor report for Instagram using NapoleonCat.
How to create a social media report in 1 minute
Creating a social media report doesn’t have to involve an Excel spreadsheet – which is especially useful when you want to really impress a client (or your boss) with something visually appealing, and not just rows and columns with numbers. (Also, when you just don’t like Excel spreadsheets or really putting numbers together is not exactly your thing, which I totally get.)
You can use a tool to automate the process – you know, select the social media profiles and the right social media metrics and then wait for the report to generate. A nicely looking report, I might add, with your (or your client’s) logo on it and visually appealing graphs (because, yes, they are important.)
And then possibly schedule it to be automatically sent to your client or boss every week or month without you having to lift a finger (you could lift a finger, though, to adjust the metrics if, for some reason, you needed to update them or the time range you want to include or make any changes.)
Let me show you how it’s done with NapoleonCat.
- Go to Reports in NapoleonCat.
- Click on Create new report.
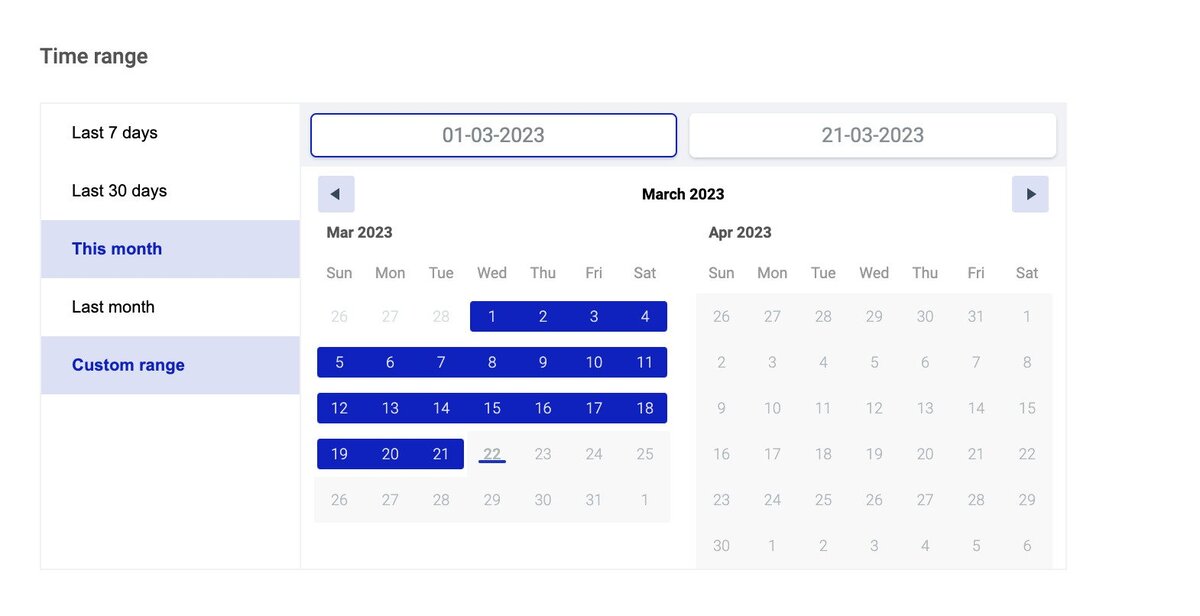
- Choose a time range (you can track metrics for entirely custom time ranges, unlike in many native analytics tools, e.g., on Instagram)
- Upload your logo if you want a nicely branded report. You can also remove the NapoleonCat branding if you want to.
- Select the profile(s) you want to include in your report from the ones you’ve connected to your NapoleonCat account and the ones you follow, like your competitors.
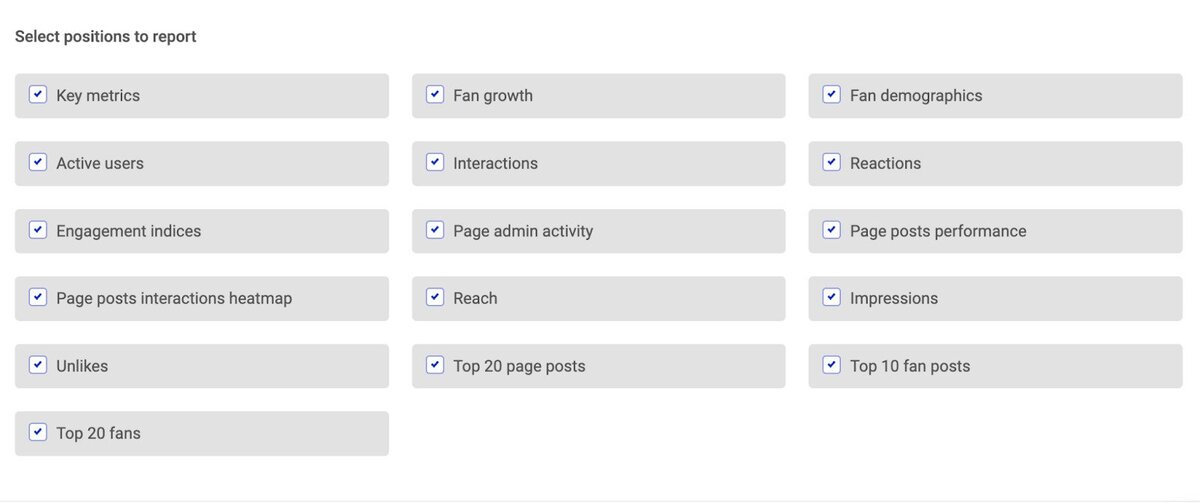
- Then select the metrics you want to include for each of the social media profiles. Here’s an example for a Facebook Page:
- Then, generate the report – you might have to wait for a little while for all the data to be crunched by the system.
- And you’re done! You can download the report or send it to whoever needs to see it. And you can also choose to schedule a report in selected intervals (for example, here’s an article on building a monthly social media report) and have it emailed to selected addresses weekly, monthly or quarterly, without having to do a thing every time.
And here’s the entire process in a video:
Social media reporting tools to make the job easier
Of course, you could use native social media analytics tools like the Meta Business Suite or LinkedIn analytics. But this has some drawbacks, like the fact that you need to use several different tools and combine them together in one place (will it be the infamous spreadsheet?) And then possibly ask your designer to design a nice PDF report for you.
But if that’s the way you want to proceed, you check out these native tools:
- The Meta Business Suite lets you export your Facebook analytics as PNG, CSV, or PDF files. You can check your audience report and your post performance, including detailed video analytics.
- If you’ve connected your Instagram Business account to the Meta Business Suite, you’ll also see your Instagram insights there.
- For LinkedIn, you can export the analytics available for your Company Page, including your visitor metrics and content impressions, and engagement for a selected time period. You can only export it as an XLS file, though (and you know what that means.)
So, I’d recommend going with a tool like NapoleonCat 😉 Here’s how to create:
You can test NapoleonCat completely for free here – no credit card required during signup 😉
Social media reports that take hours? No, thank you.
Creating a social media report really doesn’t have to be a pain 🍑And especially since with the very nature of social media (and marketing overall), they should be pretty frequent to really make sense and help you adjust your marketing strategy according to your social media performance.
So, do yourself a favor and get a tool that lets you automate the process and put together a nicely designed and – more importantly – helpful report filled with key metrics and relevant data in virtually no time.
You may also like: