
Save hours on social, every day.
Automate moderation and replies, schedule posts, and pull reports - all in one tool.
If your company offers goods or services for other businesses, the chances are that you are planning to create your own LinkedIn Company page or that you already have one.
LinkedIn is a great tool for B2B marketing, and using it wisely can significantly boost your business results. Although, making it a successful communication channel in the long term will require analyzing and optimizing your strategy.
In this article, we’ll show you how to make the most of LinkedIn Page Analytics by using its Reports.
- Find out where to access LinkedIn Analytics
- Learn how to create reports
- Discover how take full advantage of LinkedIn Analytics
One of the most important parts of executing a successful social media marketing strategy is analyzing your results regularly. Data-based decisions are the ones that drive your marketing performance most effectively. Social media platforms have analytics features built-in, so you can easily access your data. LinkedIn is no exception, and its Page Analytics tool enables you to gain insight into the performance of your LinkedIn page.
How to access LinkedIn Page Analytics
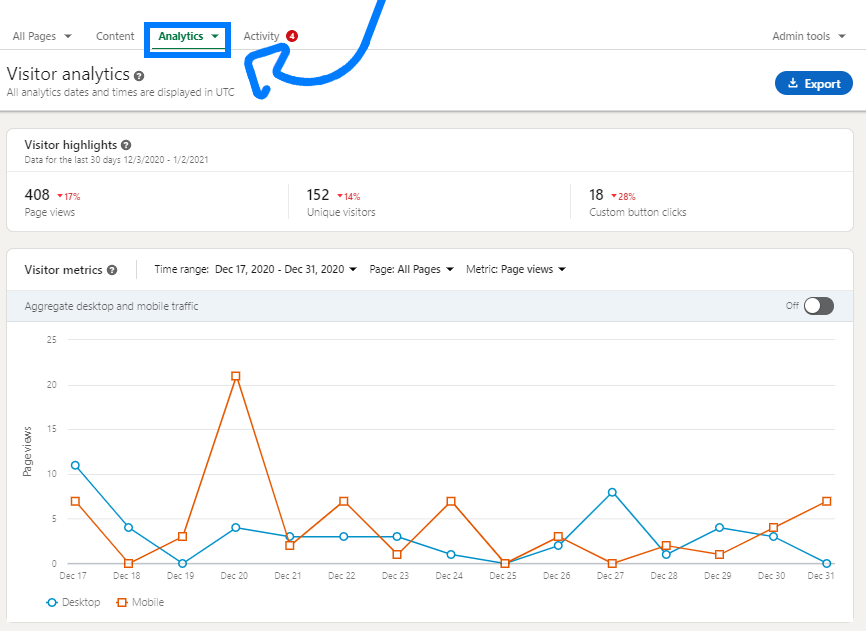
Before we get to the Reports, let’s have a quick reminder about LinkedIn Analytics in general. The first step you need to take is to enter the LinkedIn Page Analytics panel through your company page. To do that, simply go to your Page Admin View and look at your top control bar.
When you click the Analytics button, you’ll be able to choose what type of metrics you would like to lookup. Let’s see what types of data does LinkedIn offer.
Updates analytics – You can evaluate the effectiveness of your posts
Followers analytics – You can look up the details about the demographics and sources of your followers
Visitors analytics – You can look up the details about the demographics and sources of your visitors
*If you are an advanced user and you have enhanced your page with LinkedIn Career Pages and/or Pipeline Builder campaign, you’ll also have access to Talent Brand analytics and/or Pipeline Builder analytics.
Each of those sections has its own dashboard, where you can set your desired time span and view the data displayed on simple charts. The dashboards are great for everyday use, but when the need to create a more detailed report for your manager or a client arises, they might not be enough. At this point, you might want to export your data and work on it further in Excel.
If you’re just starting your adventure with LinkedIn marketing, we highly recommend that you read our article about LinkedIn Analytics before moving on to the reports. Once you have that done, read on to learn how you can take it to the next level!
What are LinkedIn Analytics Reports?
As mentioned above, if you need to do some more advanced refinements and calculations on your LinkedIn page data, it’s probably best to use MS Excel for this purpose. That’s where the Reports come in handy. The LinkedIn Analytics Report is a data export feature that enables you to transfer the data from your LinkedIn Company Page straight into an Excel sheet.
This way, you’ll be able to do all sorts of operations on your LinkedIn page data using the broad set of Excel functions.
How to create a LinkedIn Analytics Report?
Exporting the data is very easy. To do it, simply follow these steps:
- Access your Page Admin View.
- Click ‘Analytics.’
- Select Visitors, Updates, or Followers.
- Click Export in the upper right corner of the correct analytics page.
- Select the timeframe you’d like to create a report for and click Export.
- The .xls file will be accessible after it has been downloaded.
Keep in mind that LinkedIn allows you to retrieve data from up to a year into the past!
Once you have your reports downloaded, we can have a quick look at each one of them and see what’s inside. For this article, we’ll use the 30 days reports.
LinkedIn Updates Report Explained
The Updates Report covers all the data related to your LinkedIn Company Page posts. When you open the file, you’ll see 2 sheets available.
Aggregated update metrics
The first one shows the aggregated engagement metrics for your organic and sponsored updates over time. Date indicates when your updates were viewed by LinkedIn members. This part of the report gives you a detailed overview of your updates’ organic and sponsored performance in time and covers:
- Impressions
- Clicks
- Comments
- Reactions
- Shares
- Engagement Rate
Update Engagement
The second sheet shows the engagement metrics for individual updates. This part of the report allows you to see detailed data for each post that you published, including:
- Update type
- Campaign name
- Posted by (who published the update)
- Creation date
- Campaign start date
- Campaign end date
- Audience (all followers or targeted)
- Impressions
- Video views
- Clicks
- Click-Through Rate(CTR)
- Likes
- Comments
- Shares
- Follows
- Engagement rate
In both sheets, all dates and times are in UTC.
What’s Inside the LinkedIn Visitors Report
This report contains demographic data about your page’s visitors. It enables you to see if users who see your content are actually the ones you wanted to reach.
The first sheet of this report gives you an overview of your visitors’ general metrics such as their device type, number of unique visitors, etc. But it’s the other ones where you can really dig into their characteristics, including:
- Location
- Job function
- Seniority
- Industry
- Company size
- Life Page traffic
LinkedIn Followers Report Contents
The last report gives you an insight into your Company Page followers’ demographics. Its structure is similar to the Visitors Report, but this time the first sheet only includes information about new visitors.
Visitors and followers reports indicate if your communication is reaching the right audience, so analyzing this data thoroughly might result in great ideas for improving your content, targeting, or any other aspect of your LinkedIn marketing.
Remember that the data in every report might be delayed by up to 2 days.
How to Make the Most of LinkedIn Analytics using NapoleonCat
You now know how to create LinkedIn Analytics Reports. Without a doubt, this ability facilitates reporting. But what if you deal with more than one brand and/or run multiple social media profiles, and this solution is still not enough for you?
Social media reporting can get even easier with a little help from NapoleonCat’s Social Media Analytics Tool. Our reporting tool allows you to create detailed reports for all your social media profiles, including LinkedIn, with just a couple of clicks.
Advantages
Using NapoleonCat to do your social media reporting has many advantages over the ‘traditional’ way. Here’s just a couple of them:
- You can monitor multiple social media profiles across different platforms using one easy-to-navigate interface.
- You can create groups of profiles from different social media platforms to see aggregated statistics for them. This allows you for example to compare how different brands perform across different social media channels and gives you a broader picture of your competitors or benchmark industry performers.
- You can effortlessly export your data and generate visually appealing reports with an option to easily choose the KPIs that you want to include in them.
Take full advantage of LinkedIn Analytics and manage multiple profiles in one place.
Effortlessly manage multiple profiles with an all-in-one social media tool. Facebook, Instagram, Twitter, and LinkedIn, you name it. Ready to start your trial?
Make Your LinkedIn Analytics Easier
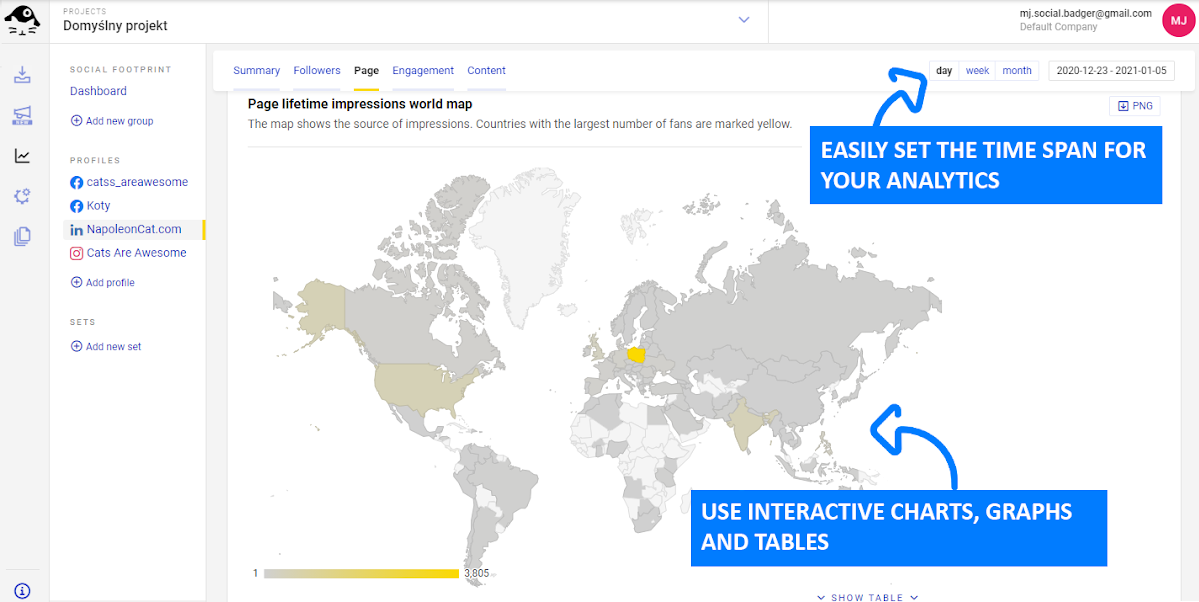
Let’s have a quick peek into the tool, so you can get an idea about using it. To access your Analytics, you’ll need to log into your NapoleonCat account and choose Analytics from the left sidebar menu.

NapoleonCat has all the tools that you need in one easy-to-use control panel
Once you’re there, you can choose the profile you want to work on or group multiple profiles according to your needs. By default, you’ll first see your Summary page, where all your key metrics are displayed. Although, the tool allows you to have a deeper look into a couple of categories of metrics:
- Followers
- Page
- Engagements
- Content
Each of those dashboards contains detailed data shown in an easy-to-read form. You can take advantage of interactive graphs, charts, and tables.
The functionalities described above are just a small chunk of NapoleonCat’s full capability. We encourage you to try it out using a free trial to discover the tools’ other features like publishing or comments and reviews management!
Wrap Up
Using LinkedIn reports is definitely a great way to bring your marketing analytics to another level. This LinkedIn feature allows for improving your reporting effectiveness and helps you get a more in-depth insight into your metrics.
Although, if you run multiple social media accounts, you might need an additional tool such as NapoleonCat. Certainly, it will help you wrap your mind around the extended amount of work.
We hope that you found this article useful, and if so, please feel free to share it with your network!
Check out our other articles about social media reporting & analytics:
- How to Create an Instagram Analytics Report
- Top 10 Social Media Analytics Tools for Teams
- The Easiest Way to Create a Weekly Social Media Report
- How to Create a Monthly Social Media Report (in under 1 minute)
- How to Create a Facebook Analytics Report (in under 1 minute)
- Creating Facebook and Instagram Analytics Reports: A Guide