Save hours on social, every day.
Automate moderation and replies, schedule posts, and pull reports - all in one tool.
Is creating social media reports part of your job, but you’re not really a fan? Or do you need to report on your Facebook activities and look for tools to replace the now-gone native Facebook Analytics? Hear me out – I have a few tips for you.
First of all, kudos to you if you’re dealing with reports on a daily basis. Reports can be a source of valuable data in digital marketing – for you, your boss, or your client, and the entire business.
They help track progress and business goals, spot improvement opportunities, decide where and how to shift your budgets, etc.
Reports simply help run more effective digital marketing campaigns (and maybe sometimes also show off in front of your client – let’s be completely fair ;))
But they can be a pain and a dreaded weekly or monthly task. Especially when you’re trying to create a Facebook analytics report that’s actually useful and insightful. Or if you’re not an expert data analyst who eats Excel sheets for breakfast.
Or you just don’t have time because generating weekly, monthly, or quarterly reports is only one of the multitude of tasks you need to tackle on a daily basis – and there’s no data analyst in your team (or you don’t want to bother them because they too don’t have time.)
OR you need a Facebook performance report and noticed that the native standalone Facebook analytics tool for the platform is no longer available (as of July 2021).
Isn’t it fortunate that you can still access Facebook analytics (and easily generate Facebook analytics reports) in NapoleonCat? 😉
Here, let me break it all down.
Create Facebook analytics reports within seconds
Generate custom Facebook Page reports within seconds. Schedule automatic reports, analyze your competitors, include up to 8 FB Pages in one report, and more – with an all-in-one social media tool.
How to make a custom Facebook analytics report without too much work
Follow the few simple steps to create an FB analytics report for your business or your client – it’s really easy.
Try NapoleonCat for free here and connect your FB Pages (no credit card required during signup).
Remember – after you connect your Facebook Page(s) to NapoleonCat, please wait up to 24 hours for the tool to collect the data for analytics and reporting.
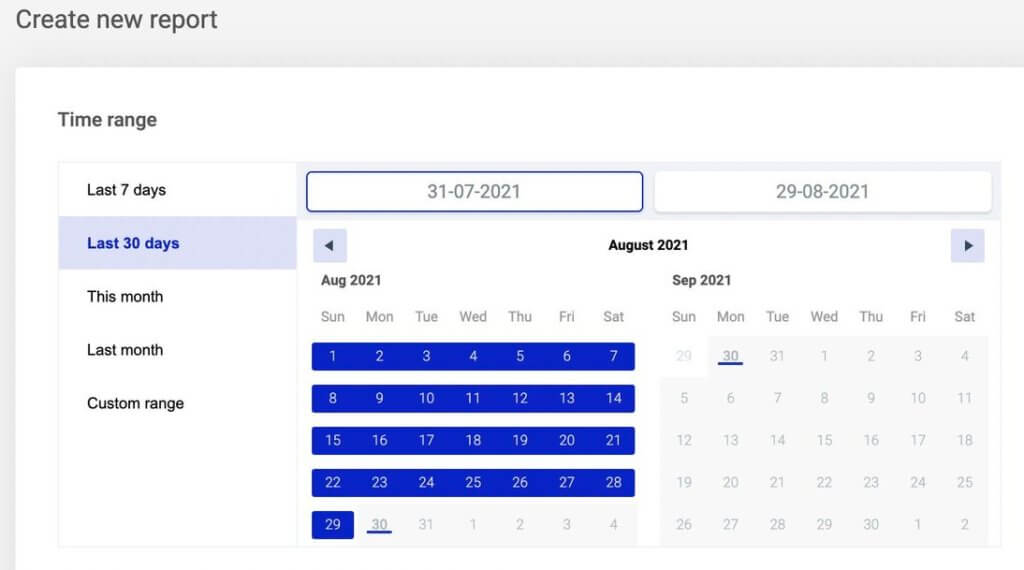
1. Go to reports in your NapoleonCat dashboard. Click “Create new report”, and select the time frame. You can select a completely custom time period for your Facebook analytics report.
By the way – you can also create analytics reports for Instagram and LinkedIn, too 😉
2. If you want to brand your report, add your company’s or your client’s logo. You can also remove NapoleonCat branding if you want.
3. Choose the Facebook Page you want to report on. You can add up to 8 Facebook Pages at once and make one comparative report.
4. Select the metrics you want to include in your Facebook analytics report. These include:
- Key metrics
- Fan growth
- Fan demographics
- Active users
- Interactions
- Reactions
- People talking about this (PTAT)
- Engagement index
- Page admin activity
- Page post performance
- Page post interactions heatmap
- Reach
- Impressions
- Unlikes
- 20 top-performing posts
- 10 top-performing posts
- 20 most engaged fans
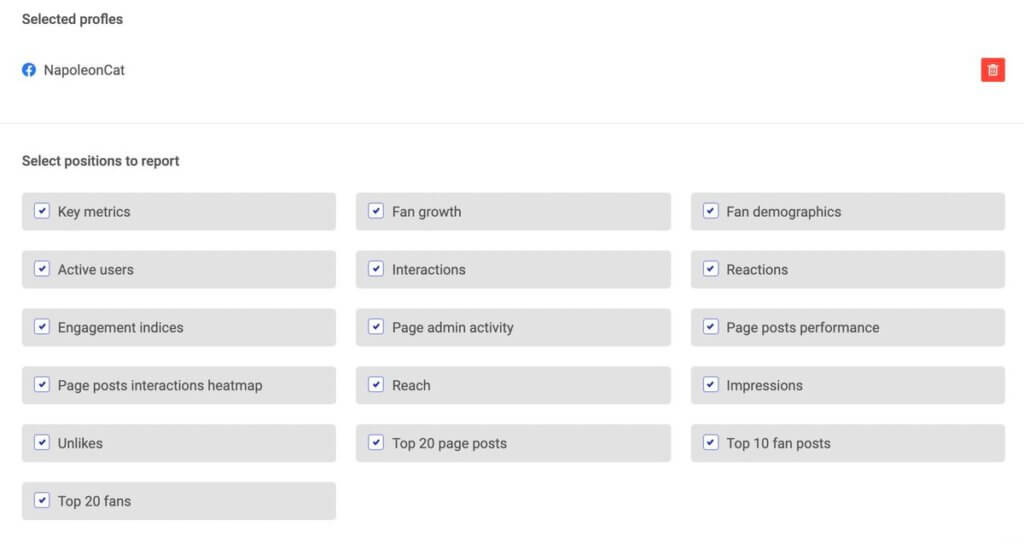
Depending on the metrics that are key to your business or your client’s business, you can include all of them or select just the relevant ones.
Say you’re reporting only on your Facebook audience and want to see fan growth specifically. You can only go with the ones related to their number and demographics, and maybe unlikes from your Facebook Page. You get the gist.
5. Click “Generate” and wait for the report to appear in your account (it can take a minute or two, depending on the volume of the data the system needs to crunch).
6. Then you can do a few things:
- Download a PDF and save it on your hard drive or circulate it among whoever needs to have access. (You’ll also get an email with a link.)
- Schedule your report to get sent directly via email to designated recipients (so you don’t have to do it manually.)
- Create a similar report to the one you just created.
- Edit or delete it.
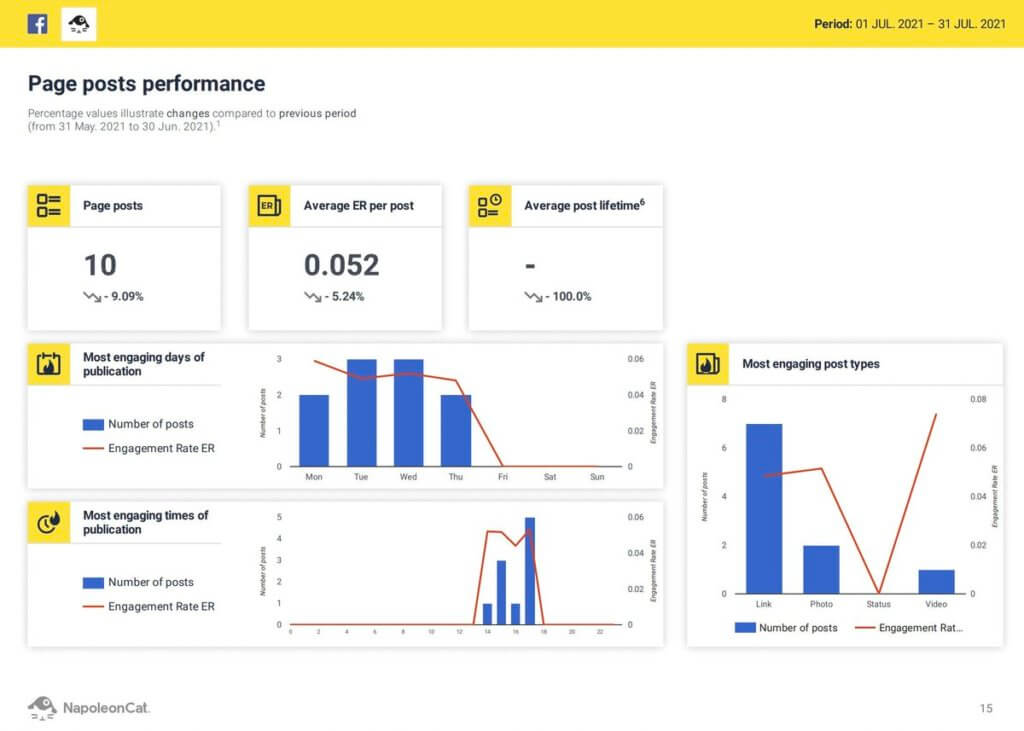
Here’s what a sample page from such a Facebook analytics report looks like (the report usually has around 30 pages of data):
You can also watch this video for a step-by-step tutorial:
Or you can schedule a recurring Facebook analytics report (for even less work)
Here’s how to do that to avoid creating the report every time you need to send it:
1. Click ”Schedule Report”
2. Insert the emails you want the report to be sent to (like your team manager, CMO, CEO, or your client).
3. Define the intervals you want to send your report in. You can send your reports every week, every month, or every quarter.
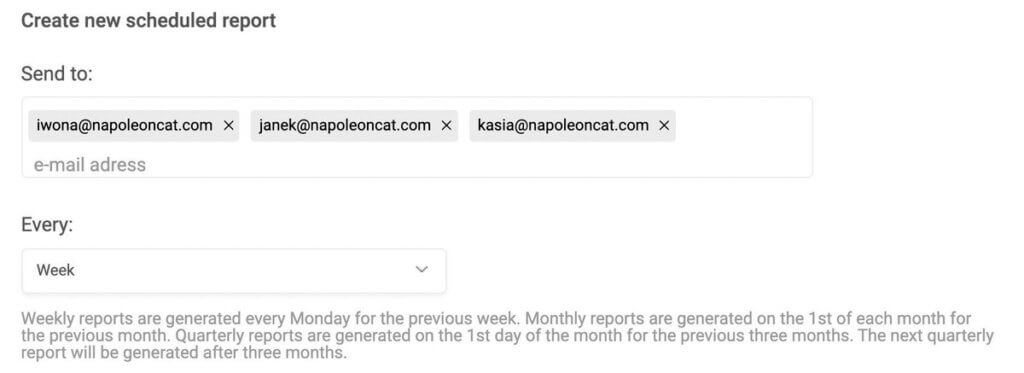
4. The rest of the process remains the same.
5. You can see all your scheduled reports in the – you guessed it – “Scheduled reports” tab.
This way, you schedule your Facebook analytics report once and then wait for the email to come in – like a boss!

Facebook Page Report Generator
Create Facebook analytics reports in seconds. Schedule and automate report delivery. Analyze your own accounts and your competitors, too – with an all-in-one social media tool.
Get Facebook analytics reports for your competitors’ social media
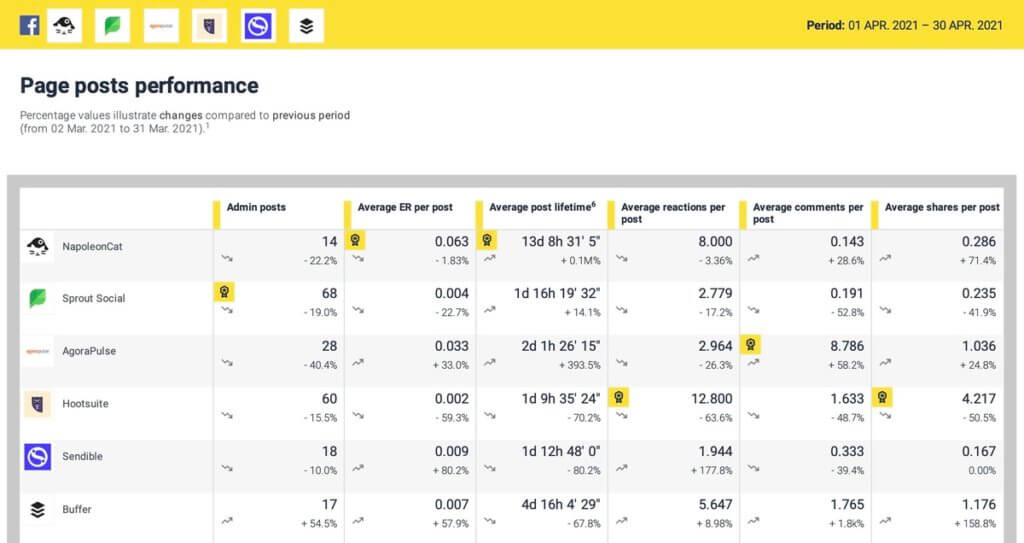
With NapoleonCat, you can create Facebook analytics reports for other FB Pages – and include them in a single report.
Such Facebook competitive reports will allow you to easily compare your social media marketing performance with your competitors.
You can create a report for any public Facebook Page to see how their page views, post reach, post performance, engagement rate, or fan growth compare to yours – and look for ways to get ahead.
And in case you were wondering…
How to report Facebook analytics for your company
First of all, do you know your essential KPIs? What really moves the needle? What are the metrics that are key to achieving your business objectives?
Then match those to your Facebook analytics report metrics
Of course, some vanity metrics like post reach might still be interesting to see (and impressive for your boss), but pay special attention to what really matters to the business:
- What content brings in customers?
- What content brings traffic to your website?
- What content gets people engaged? (And as a result, brings in new customers?)
In other words, align your Facebook performance report with your social media marketing strategy and overall digital marketing goals to show the decision-makers what Facebook marketing really brings for the business. (And that it’s not just scrolling through your Facebook feed ;))
How to create a Facebook analytics report for a client
It’s pretty similar – but a lot will depend on your relationship with your client and their goals. And their proficiency in reading and interpreting Facebook statistics.
Again, focus on the metrics that are relevant to your client’s situation – and include these in the report. If you want to impress them – which of course you will – include the numbers that look great (e.g., if you’ve seen particularly impressive growth in the Facebook audience or their engagement).
But remember, the client might love the numbers, but they will want to know how they affect their business. So if you want to build trust, don’t just use vanity metrics – look for what really moves the needle.
You can always just include all the available metrics you can find in NapoleonCat and then walk your client through them on a weekly status call, focusing on the most important ones.
Also, don’t forget to brand your report, so that it looks like it’s coming from your agency, helping build a professional image for your own brand.

Automate Facebook Analytics Reports
Schedule weekly, monthly, or quarterly reports. Automate report delivery to your clients – with an all-in-one social media tool.
Conclusion
As you can see, creating a Facebook analytics report is super easy with NapoleonCat – and the tool can replace the no longer available native Facebook analytics tool – start your free 14-day trial and see for yourself 😉
It’ll save you time and automate the Facebook reporting process, so you have more time to attend to your client or figure out the next steps for your business, based on what your numbers tell you.
Check out our other articles about social media reporting & analytics:
- How to Create an Instagram Analytics Report
- Top 10 Social Media Analytics Tools for Teams
- The Easiest Way to Create a Weekly Social Media Report
- How to Create a Monthly Social Media Report (in under 1 minute)
- Creating Facebook and Instagram Analytics Reports: A Guide
- Your Guide to LinkedIn Analytics Reports