
Save hours on social, every day.
Automate moderation and replies, schedule posts, and pull reports - all in one tool.
Table of Contents
- The 20 best social media analytics tools at a glance
- The tools, reviewed
- How far back your data actually goes
- The day you connect is day zero
- What the networks actually let a tool measure
- Is that competitor data real, or just public maths?
- What happened when Instagram killed Impressions
- Free social media analytics tools, honestly sorted
- Social media reporting tools: branded, white-label, and what each one costs
- Analytics for what happens in the comments
- How we put this together
- Social media analytics tools: your questions, answered
Every social media analytics tool will show you reach, engagement and follower growth – all of them, more or less identically. The interesting question is a different one: how far back can it show you, and what happens to the numbers you already had when a network changes its mind?
That second question is not theoretical. It has an exact date. On 21 April 2025 Meta retired the Instagram Impressions metric in Graph API v22.0 and replaced it with Views. Accounts connected before that date kept their stored impressions. Accounts connected after it show a flat zero, because the API no longer returns the field. Six separate vendors published help-centre notices about it in the same few weeks. Not one of the analytics listicles currently ranking for this phrase mentions it – not one.
So this guide reviews 20 social media analytics and reporting tools with prices read off each vendor’s own pricing page, and then spends its second half on the things that decide whether the tool is any use in a year – how much history you get, whether it backfills anything when you connect an account, what the networks actually expose, and whether your client report is genuinely white-label or just has your logo on a vendor’s domain.
- The 20 best social media analytics tools at a glance
- The tools, reviewed
- How far back your data actually goes
- The day you connect is day zero
- What the networks actually let a tool measure
- Is that competitor data real, or just public maths?
- What happened when Instagram killed Impressions
- Free social media analytics tools, honestly sorted
- Social media reporting tools: branded, white-label, and what each one costs
- Analytics for what happens in the comments
- How we put this together
- Social media analytics tools: your questions, answered
Key Takeaways
- No tool can see a competitor’s reach. Meta’s public discovery endpoint returns follower count, media count, and per-post likes, comments and views. That is the entire list. Every “competitor engagement rate” in every dashboard is public likes divided by public followers – useful, but not the same kind of data as your own reach.
- The clock starts the day you connect, and follower history is gone for good. Socialinsider says it plainly: “we start gathering followers’ insights from the day the profile is added.” Rival IQ: “it will never have follower counts prior to when the handle was added.” Connect every profile you might ever want to report on today, on a free tier if you like – it costs nothing and it starts the clock.
- Instagram Impressions stopped existing on 21 April 2025. Meta replaced the metric with Views in Graph API v22.0. Accounts connected before that date kept their stored impressions; accounts connected after it show a permanent zero, because the API no longer returns the field. And because Views counts replays and Impressions did not, year-on-year comparisons across that date are not comparing the same thing.
- You cannot ask LinkedIn how a post performed last quarter. The API does not support time-bound statistics for specific posts, so per-post LinkedIn numbers are lifetime totals only. Page-level statistics return views and clicks rather than impressions or reach – which means “LinkedIn organic reach” in a dashboard is really post-level share data.
- How much history you get varies by a factor of nearly two hundred, and it is a pricing lever nobody names. Brand24 gives 30 days. Brandwatch holds an archive back to 2010. Rival IQ charges $320 more a month to move from six months to twenty-four. Compare the history you get for the price, or you are not comparing the same product.
- On white-label reporting, a $44 tool beats a €699 one. DashThis gives you your logo, no vendor branding and a custom domain from $44 a month. Whatagraph white-labels from €699 and still charges extra for the domain.
The 20 best social media analytics tools at a glance
| # | Tool | Best for | Starts at | History you get | Free plan |
|---|---|---|---|---|---|
| 1 | NapoleonCat | Reporting on the comments as well as the content | from $89/mo (2 users, 5 profiles) | ~2 months pulled in on connect, up to 24 months on request | No, 14-day trial, no card |
| 2 | Sprout Social | The report you defend to a board | $79 per seat/mo annually | Varies by network, best documented in the category | No, 30-day trial |
| 3 | Hootsuite | Big teams, broad coverage | $99 per user/mo annually | Listening 7 days Standard, 30 Advanced | No, 14-day trial |
| 4 | Rival IQ | Competitive benchmarking | $239/mo | 6 months, 12 or 24 by tier | No, 14-day trial, no card |
| 5 | Socialinsider | Benchmark data you can pipe into BI | $82/mo | 3 months, 6 or 12 by tier | No, 14-day trial, no card |
| 6 | Metricool | Cheap analytics across many brands | from $20/mo annually | 30 days on free, longer on paid | Yes, 1 brand |
| 7 | Iconosquare | Instagram and TikTok depth | €33/mo billed yearly | Not published | Yes, 2 profiles |
| 8 | Buffer | Simple reporting attached to publishing | $6 per channel/mo | Not published | Yes, 3 channels |
| 9 | Agorapulse | ROI attribution plus inbox reporting | $79 per user/mo annually | Not published | No, 30-day trial |
| 10 | Brandwatch | Listening at real scale | No published price | Back to 2010, 1.7 trillion conversations | No |
| 11 | Lumen by Talkwalker | Enterprise listening | No published price | Up to 5 years on paid | Free tools only, 7 days |
| 12 | Social Status | Analytics only, paid and organic | $9/mo | 1 month free, up to 3 years on Platinum | Yes, permanent |
| 13 | Brand24 | Mention monitoring on a budget | $199/mo annually, $249 monthly | 30 days only | No, 14-day trial, no card |
| 14 | Mentionlytics | Multilingual mentions and sentiment | $29/mo | 18 months on every tier | No, trial, no card |
| 15 | BuzzSumo | Content research and share data | $199/mo billed yearly | 2 years, up to 5 by tier | No, trial, length not stated |
| 16 | Whatagraph | Multi-source client reporting | €699/mo, annual only | Zero on connect for Instagram and LinkedIn | No, 14-day trial |
| 17 | DashThis | White-label dashboards, cheaply | $44/mo | 13 months | No, 14-day trial |
| 18 | Zoho Social | Cheapest credible paid reporting | $10/mo annually | 15 days on Standard, 1 year on Premium | Yes, 1 brand |
| 19 | Sendible | Agency reporting without per-seat costs | $29.75/mo billed yearly | Not published | No, 14-day trial |
| 20 | Siftsy | Comment intelligence | No published price | 24 months, 72 months or lifetime by tier | No |
Two things worth noticing in that table before you read further. The “history” column varies by a factor of nearly two hundred across these tools, from Brand24’s 30 days to Brandwatch’s archive back to 2010, and it is the column nobody else publishes. And four of the twenty publish no history figure at all, which is itself information – and not the good kind.
The tools, reviewed
1. NapoleonCat
Best for: teams who have to report on the conversation, not just the content.
Most analytics tools measure the feed. They tell you reach, engagement and follower growth, and they stop at the edge of the comment section. NapoleonCat measures both sides, which is a smaller claim than “best analytics platform” – and a more useful one if your team spends its day answering people.
The performance reporting is what you would expect, and it’s solid: engagement rate, reach, impressions, video views, follower growth, hashtag performance and audience demographics, across Facebook, Instagram, TikTok, YouTube and LinkedIn company pages.
Reports build from templates rather than a blank page. There are ready ones for a Facebook analytics report and an Instagram analytics report, they cover every profile you manage in one document, they carry your own logo, and they send themselves weekly, monthly or quarterly to whoever needs them.
Benchmarks let you track profiles you do not own alongside your own, so competitor comparison does not need admin access. One caveat we publish openly: a monitored profile returns less than a managed one. An Instagram account you only watch has no follower age or gender breakdown, because the API does not hand that over for accounts you do not run.
You can pull any timeframe up to 24 months back, with no cap on custom plans. YouTube is the exception at one month, and that limit is Google’s, not ours.
Competitor benchmarking works on any public Facebook Page or Instagram account, not only the ones you admin, and it goes as far as posting frequency, best posting windows, which formats are winning, top posts by engagement rate and which hashtags actually earn engagement.
Then the part that is genuinely difficult to buy elsewhere. Moderation reports put response times, comment volumes, and how much your team hid, deleted or answered right next to the content results. Inbox sentiment analysis tells you how the mood is moving. If the question you get asked in the Monday meeting is “are we keeping up with the comments”, this is the tool that answers it in a PDF.
The numbers: from $89/mo for 2 users and 5 profiles. Capacity is sold in published steps rather than per seat:
| Users / profiles | Standard | Pro | Expert |
|---|---|---|---|
| 2 / 5 | $89/mo | $109/mo | $139/mo |
| 5 / 10 | $149/mo | $189/mo | $249/mo |
| 10 / 20 | $249/mo | $299/mo | $369/mo |
| 15 / 40 | $349/mo | $419/mo | $519/mo |
| 20 / 60 | $499/mo | $619/mo | $799/mo |
Automated social media reports cover Facebook, Instagram, LinkedIn, TikTok and YouTube. 14 days free, no credit card. EU-based and EU-hosted.
Where it isn’t the answer: if you need open-web listening, share of voice across news and forums, or sixteen years of archive, buy Brandwatch or Lumen by Talkwalker and don’t let anyone tell you otherwise.
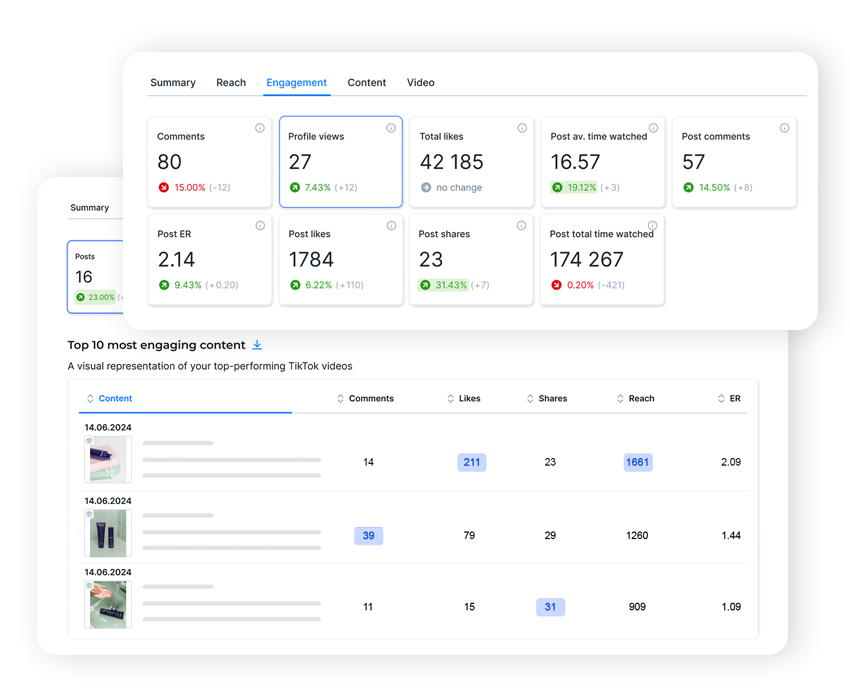
In-depth social media analytics & reporting tools
Analyze your performance across different social media platforms. Generate reports for your own profiles and your competitors’, too – with an all-in-one social media tool.
2. Sprout Social
Best for: the report you have to defend in a room full of people who don’t work in social.
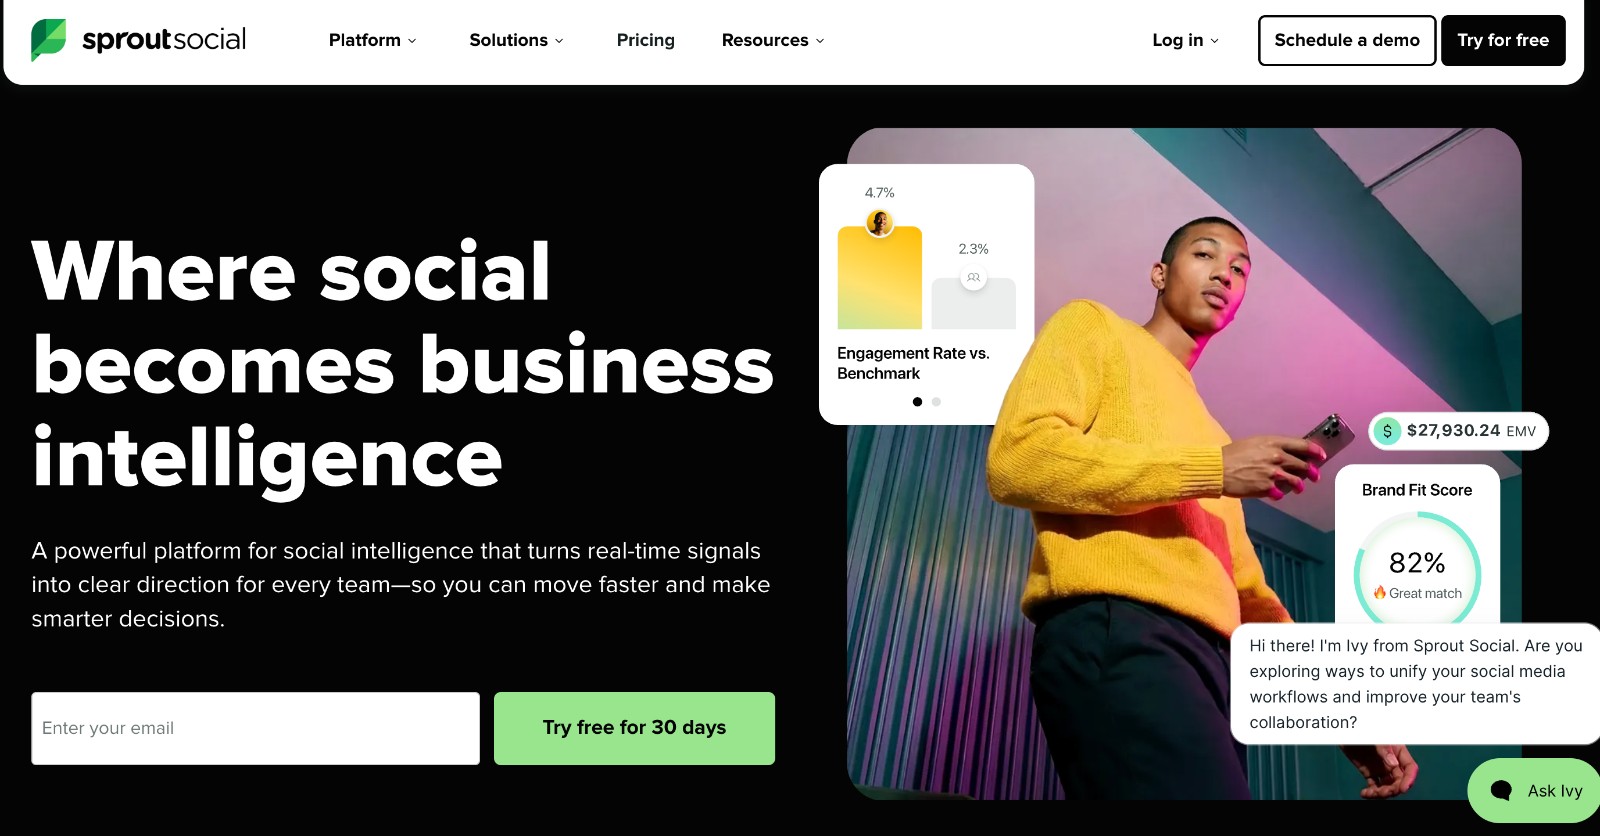
Sprout’s reporting is the most respected in this category and its documentation is the best in the business. It is the only vendor here that publishes a network-by-network table of exactly what data you get and how far back, and that table is worth reading before you buy anything at all – from anyone, including us.
Some of what’s in it: Facebook profile metrics go back two years but only the last 500 posts. X audience metrics have no backfill at all. LinkedIn gives you the last 90 days of posts. TikTok backfills 60 days on connection, then holds 365 days and a maximum of 500 videos. And Instagram Stories, in Sprout’s own words, have “no historical backfill available”.
The catch is packaging. Custom reports, cross-network reports, paid reports, competitor reports and internal performance reports all sit inside Premium Analytics, an add-on, and Sprout does not publish its price. Competitor slots run 5 on Standard against 20 on Advanced.
The numbers: $79 / $199 / $299 / $399 per seat/mo annually. 30-day trial, no card. Our Sprout Social pricing breakdown covers the add-ons.
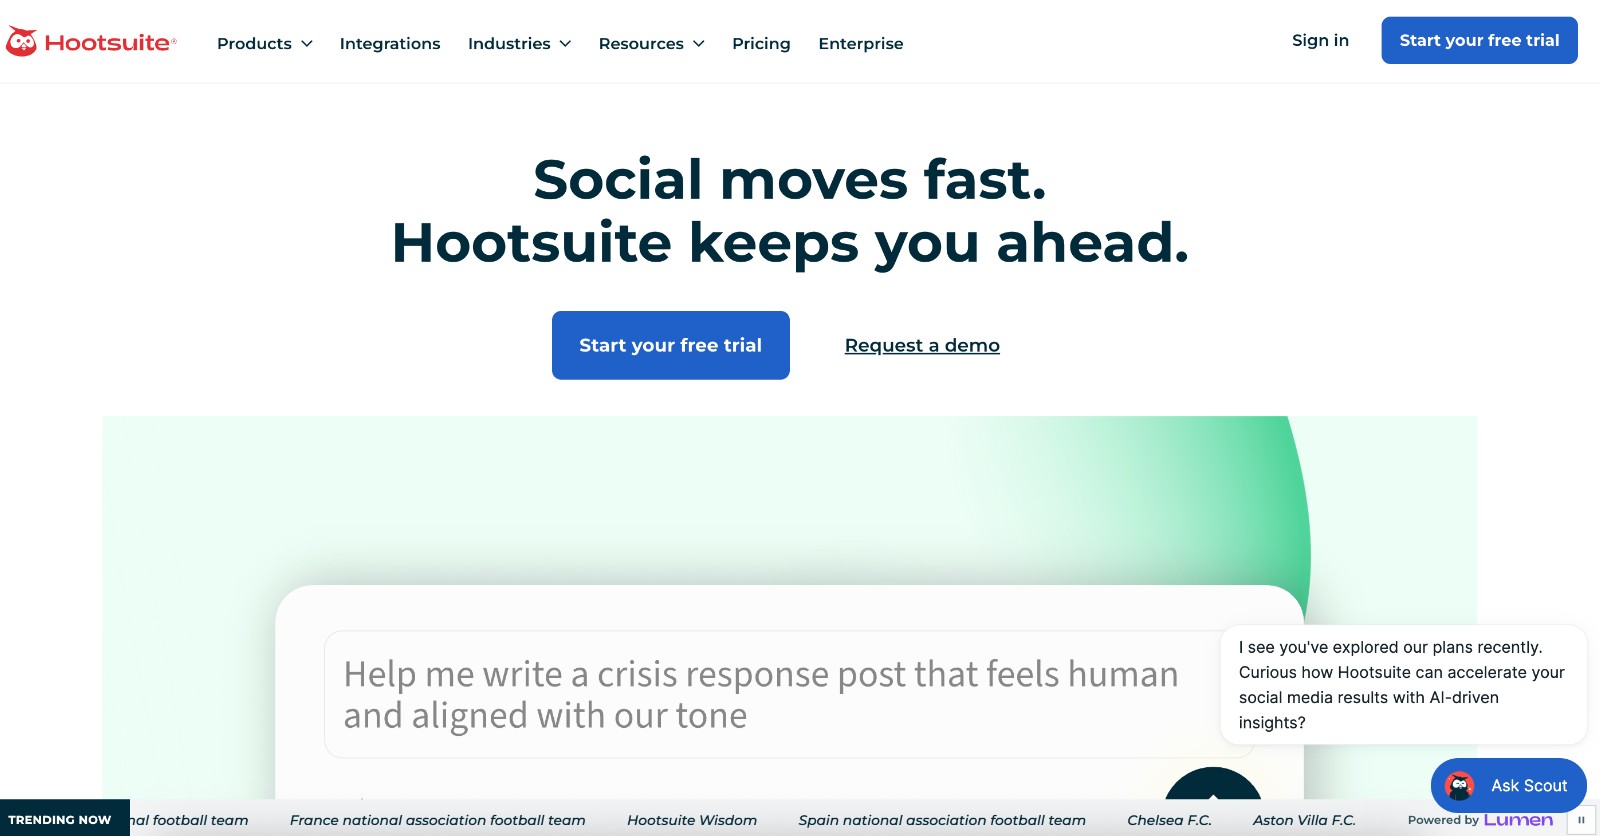
3. Hootsuite
Best for: breadth, when a lot of departments need the same dashboard.
Hootsuite’s analytics got a serious upgrade when the company absorbed Talkwalker, whose listening engine now sits underneath it. In March 2026 it also added an external API for pushing data into BI tools, which is the thing enterprise buyers kept asking for.
Watch two numbers. Listening history is 7 days on Standard and 30 on Advanced, which is short if you are trying to explain a spike after the fact. And competitor tracking is 5 profiles on Standard against 20 on Advanced, the same split Sprout uses.
The numbers: $99, $199 and $399 per user/mo, billed annually. 14-day trial, no card. See our Hootsuite pricing guide.
4. Rival IQ
Best for: finding out whether your numbers are actually any good.
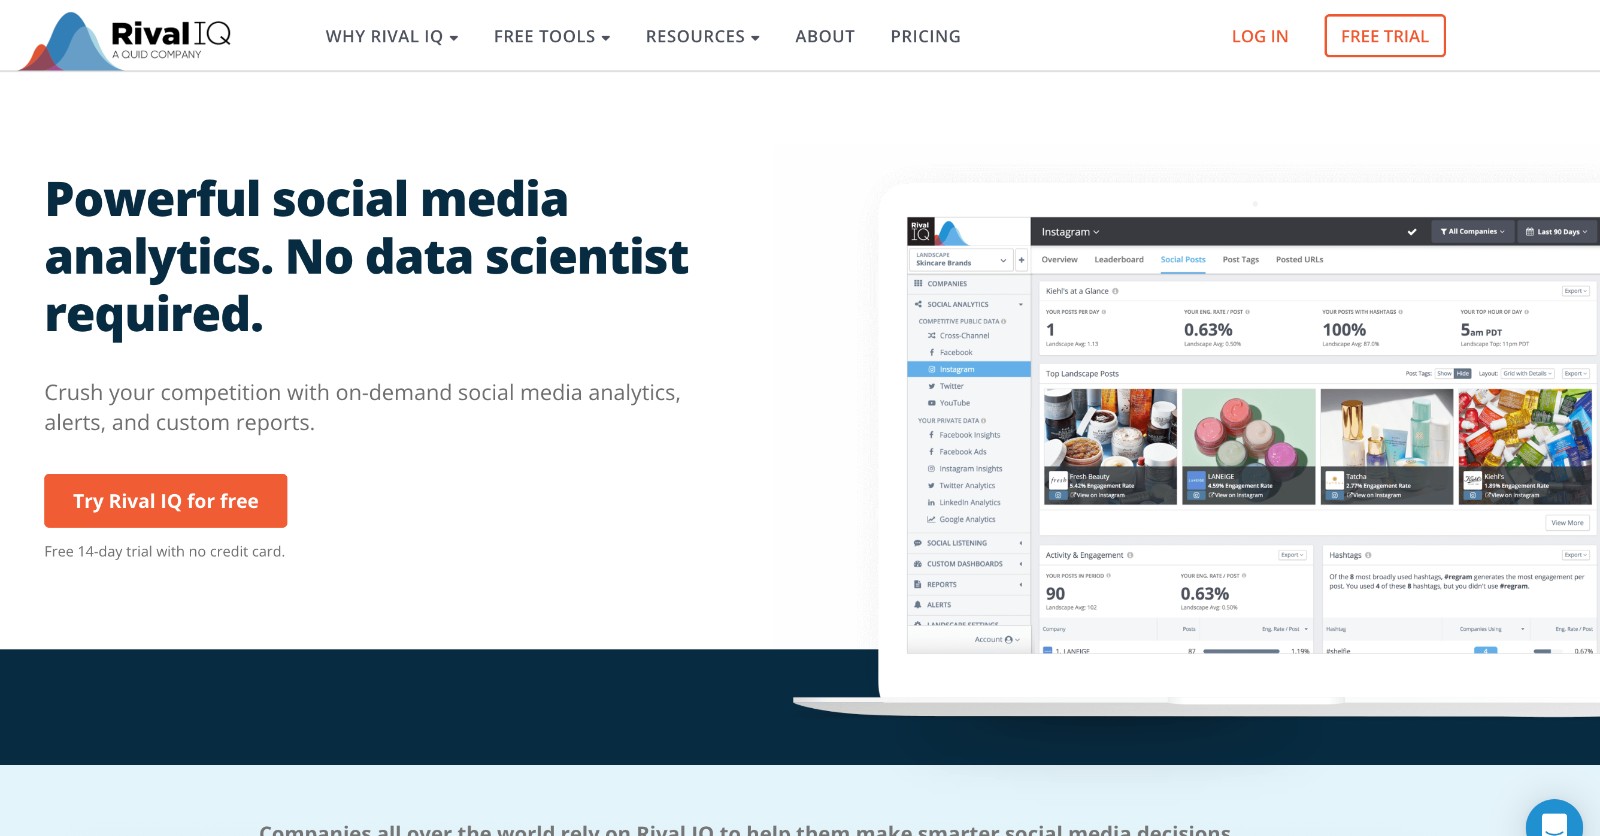
Rival IQ is a benchmarking product rather than a social media tool that also benchmarks, and the difference shows. It publishes industry benchmark reports the whole profession quotes – and its per-company model means you are always looking at yourself next to someone.
It is also refreshingly honest about where the data comes from. Public competitor data is exactly that, collected without any connection, capped at the last 3,200 results on X and 2,000 on Facebook and Instagram. Private data covers only the accounts you connect. And on followers: “Rival IQ will track the number of followers moving forward, but it will never have follower counts prior to when the handle was added to the database.”
The numbers: Drive $239/mo, 10 tracked companies, 1 user, 6 months of history. Engage $349/mo, 20 companies, 2 users, 12 months. Engage Pro $559/mo, 40 companies, 5 users, 24 months. Extra companies 5 for $50/mo, extra users $10/mo. 14 days free, no card. Annual billing saves 15%, though the page doesn’t show the resulting figure.
5. Socialinsider
Best for: benchmark data you intend to pipe somewhere else.
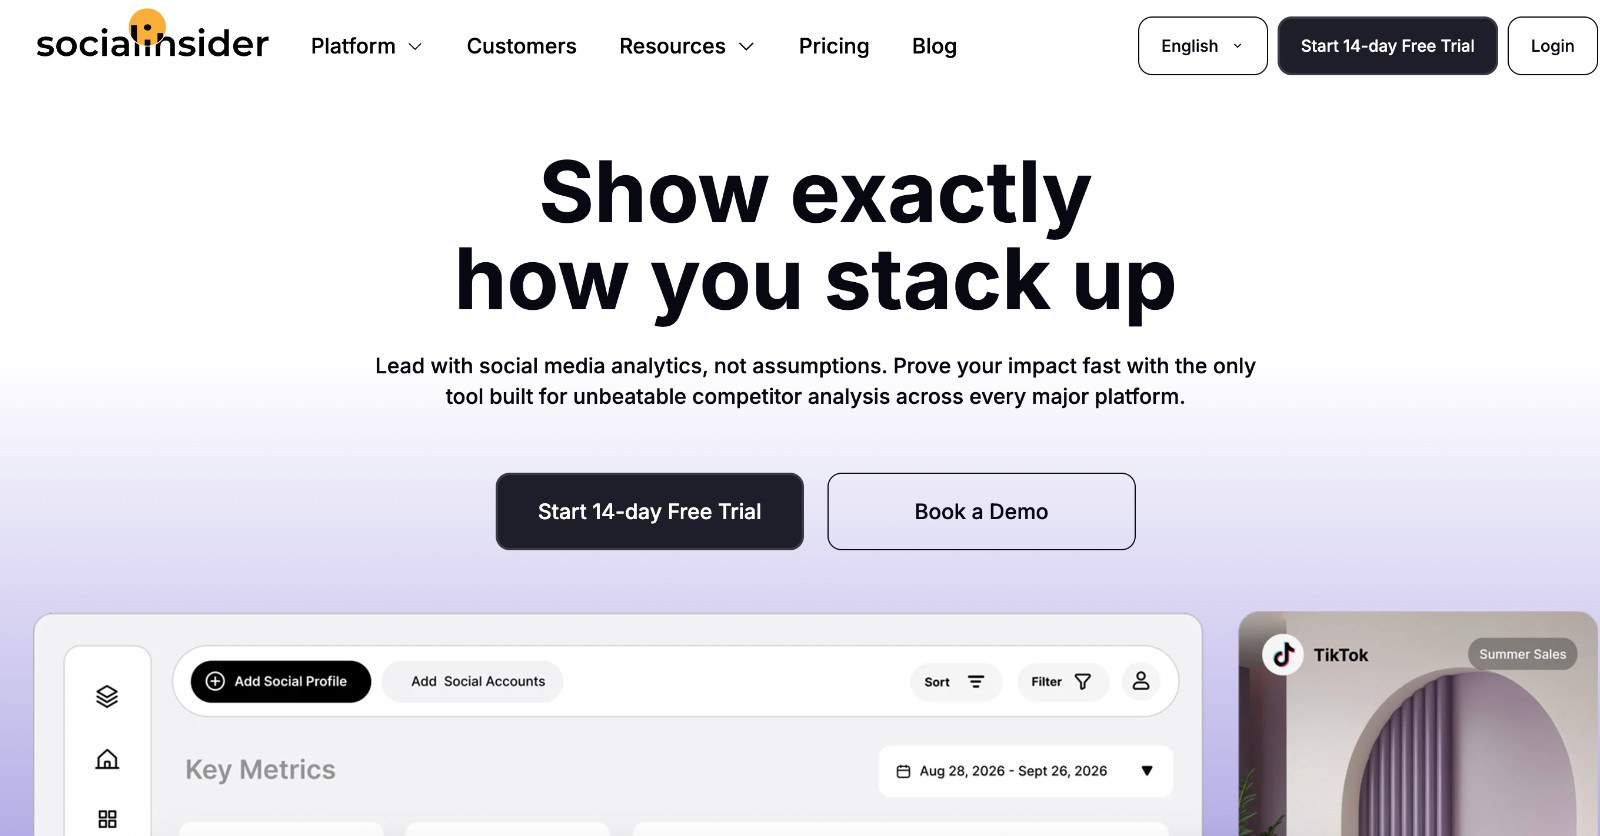
Socialinsider does competitor and campaign analytics properly and has an API and a Looker Studio connector for teams that want the numbers in their own stack. It is the tool an in-house analyst tends to end up with – and stays with.
It also wins the honesty award in this entire guide. Rather than quietly showing you an empty chart for the period before you signed up, Socialinsider fills the gap with modelled estimates and marks them as estimates: dashed lines instead of solid, plus a label reading “Based on estimated historical data”. Their explanation is worth quoting because it applies to every tool here, not just theirs: “due to API limitations from all social platforms, we start gathering followers’ insights from the day the profile is added.”
The numbers: Adapt $82/mo, 20 profiles, 1 seat, 3 months of history. Optimize $124/mo, 30 profiles, 2 seats, 6 months. Predict $199/mo, 40 profiles, 5 seats, 12 months. Extra profiles $6/mo, extra seats $15/mo, API $100/mo, Looker Studio $100/mo. 14-day trial, no card.
6. Metricool
Best for: measuring a lot of brands without paying per person.
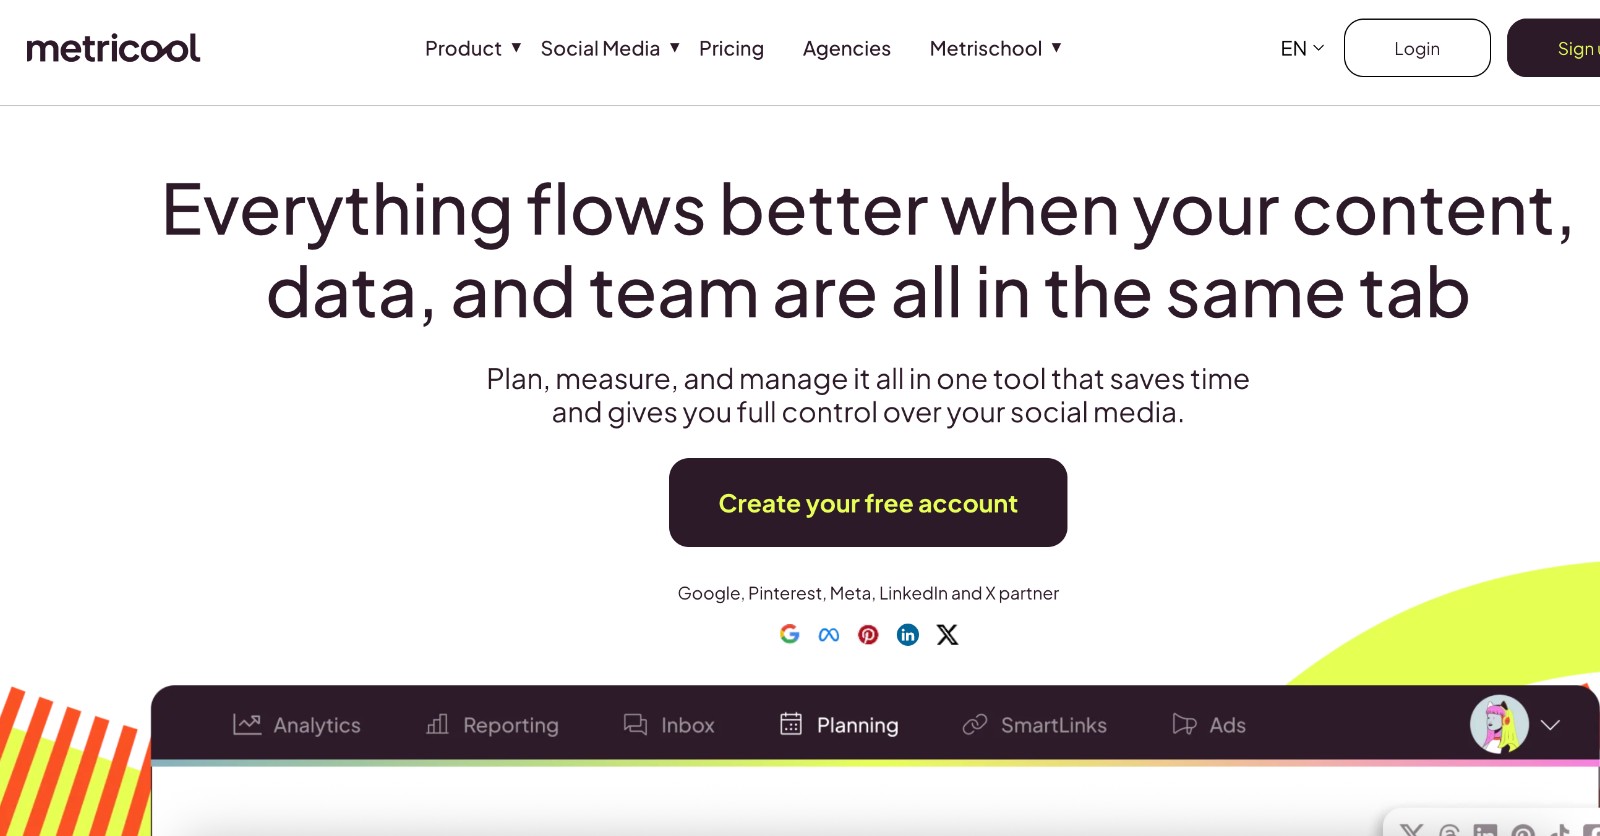
Metricool bills per brand and gives you unlimited team members from the Advanced plan, which makes it the cheapest way on this list to get real analytics across a portfolio. Its help centre is also unusually good at telling you when a network is the problem rather than the tool – which is most of the time.
Two of its own notices are the best documentation of API reality you’ll find anywhere. On TikTok: “if certain metrics such as reach or total watch time don’t display data, it’s likely that the video has been inactive for more than 7 days”, and daily follower gain and loss simply don’t exist for personal accounts. On Instagram: accounts connected after April 2025 show Impressions as zero, permanently, because the field is gone.
The numbers: Free forever with 1 brand, 30 days of analytics and no LinkedIn or X. Starter from $20/mo annually for 5 brands. Advanced from $53/mo for 15 brands with unlimited team members. X is a $10 per account add-on.
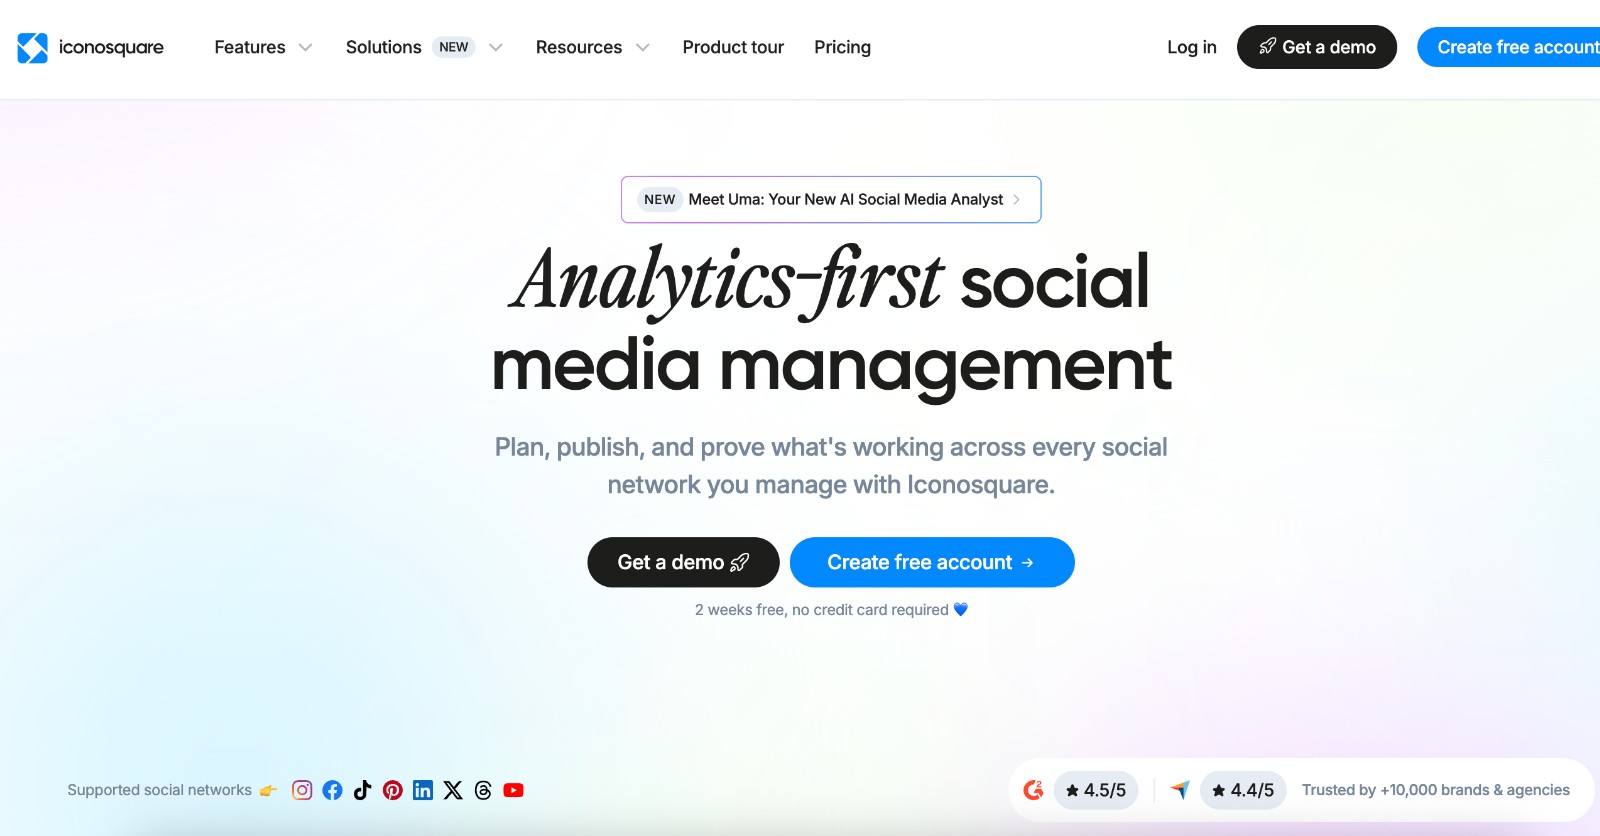
7. Iconosquare
Best for: Instagram and TikTok measured properly.
Iconosquare has been an analytics product since before most of this list existed, and the depth on Instagram shows. Benchmarking against your industry is built in – not bolted on.
Two things to know. It was acquired by Positive on 19 May 2026 and is still sold standalone, with an announced direction of deeper integration into another platform. And publishing from it is capped at 25 posts, Stories or Reels a day, so treat it as an analytics tool that also publishes rather than the reverse.
The numbers: Free forever with 2 profiles, 1 user and 10 posts a month per profile. Launch €33/mo billed yearly for 5 profiles and 1 user. Extra users €16/mo. 14-day trial, no card. Prices render in euros and vary by region.
8. Buffer
Best for: enough reporting to answer the question, attached to the thing that publishes.
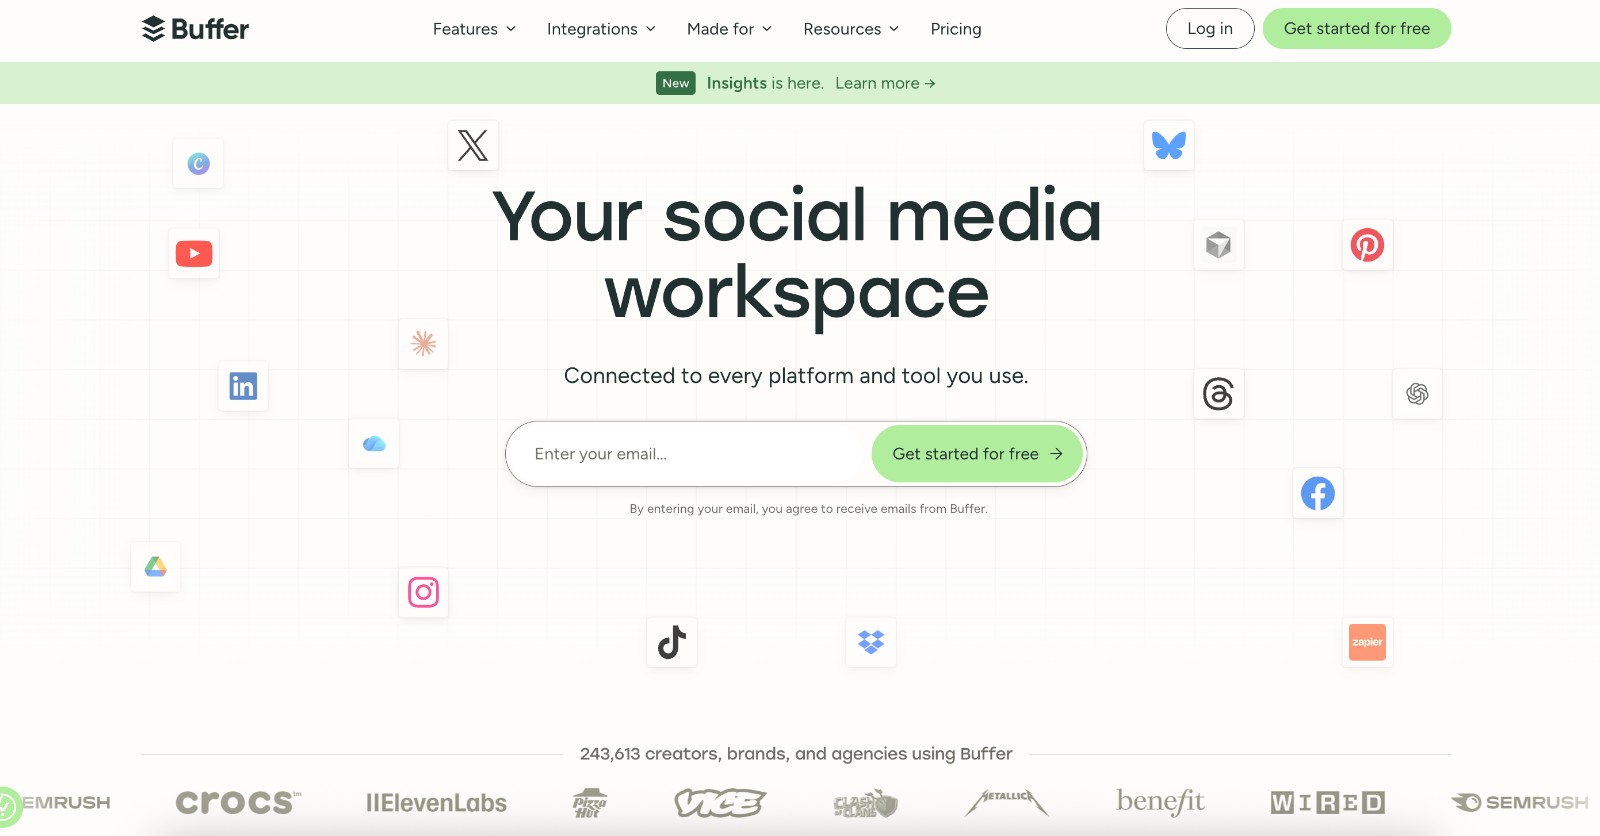
Buffer’s analytics are deliberately simple: what performed, when to post, a clean report you can hand over. For a small brand that is often the honest right answer – and because Buffer bills per channel rather than per person, the whole team can look at it for nothing extra.
Branded PDF exports need the Team plan. There is no listening, no sentiment and no competitor tracking. Buffer doesn’t pretend otherwise – which is more than can be said for some of the tools further up this page.
The numbers: Free forever with 3 channels and 1 user. Essentials from $6 per channel/mo. Team from $12 per channel with unlimited users.
9. Agorapulse
Best for: tying social activity to revenue, and reporting on the inbox.
Agorapulse’s Social ROI report wires into Google Analytics and is the reason most people buy it. Less famous, and more interesting for the purposes of this article, are its Community Management Reports, which track response times per team member, and how many items were replied to, reviewed, hidden or deleted. Agorapulse publishes a whole feature page about them and almost nobody quotes it.
Its free plan was retired on 6 July 2026, though its own pricing FAQ still promises one, and every self-serve tier caps at 10 social profiles.
The numbers: Standard $79 per user/mo annually, $99 monthly. Professional $119. Advanced $149. 30-day trial, no card. More in our Agorapulse pricing guide.

10. Brandwatch
Best for: the questions that need an archive rather than a dashboard.
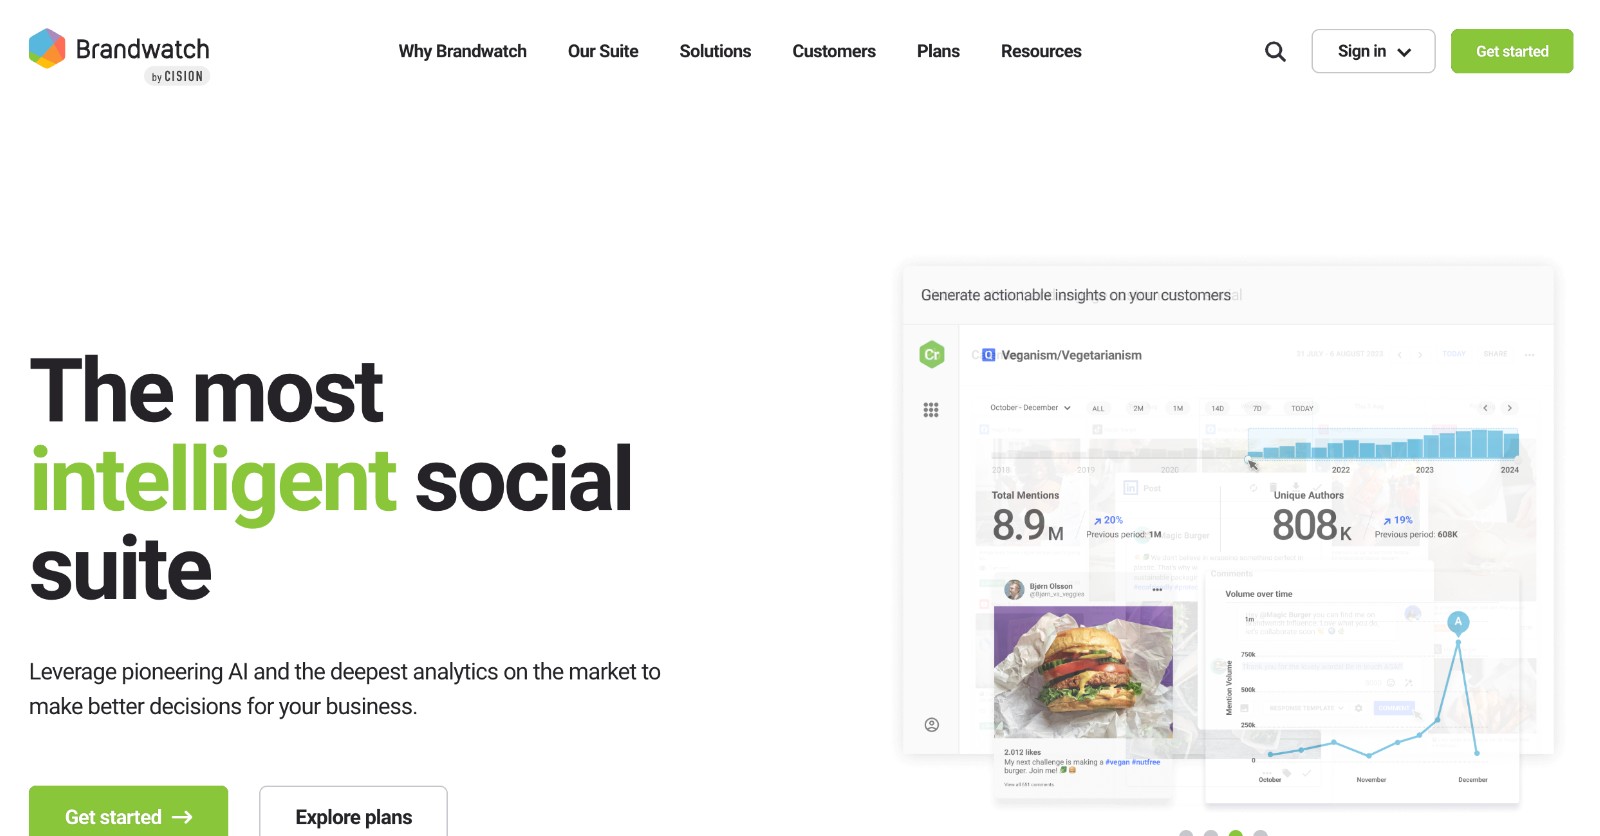
Brandwatch is not competing with anything else on this page. It holds 1.7 trillion historical conversations going back to 2010, across social, news, blogs and forums, and it is the tool you buy when the question is “what did people say about this category in 2019”.
Its own documentation on connecting channels is also unusually specific, and one line stands out: connect an X account and you get the last 7 days. Not seven months – seven days. Facebook gives two years or roughly 600 ranked posts per year, Instagram indexes 365 days of posts but only 200 days of channel metrics, LinkedIn gives two years of posts but 30 days of content metrics.
The numbers: no published price. Quote only. In Listen, a saved search loads one year of history, extended to two years with a premium add-on.
11. Lumen by Talkwalker
Best for: enterprise listening, now under Hootsuite’s roof.
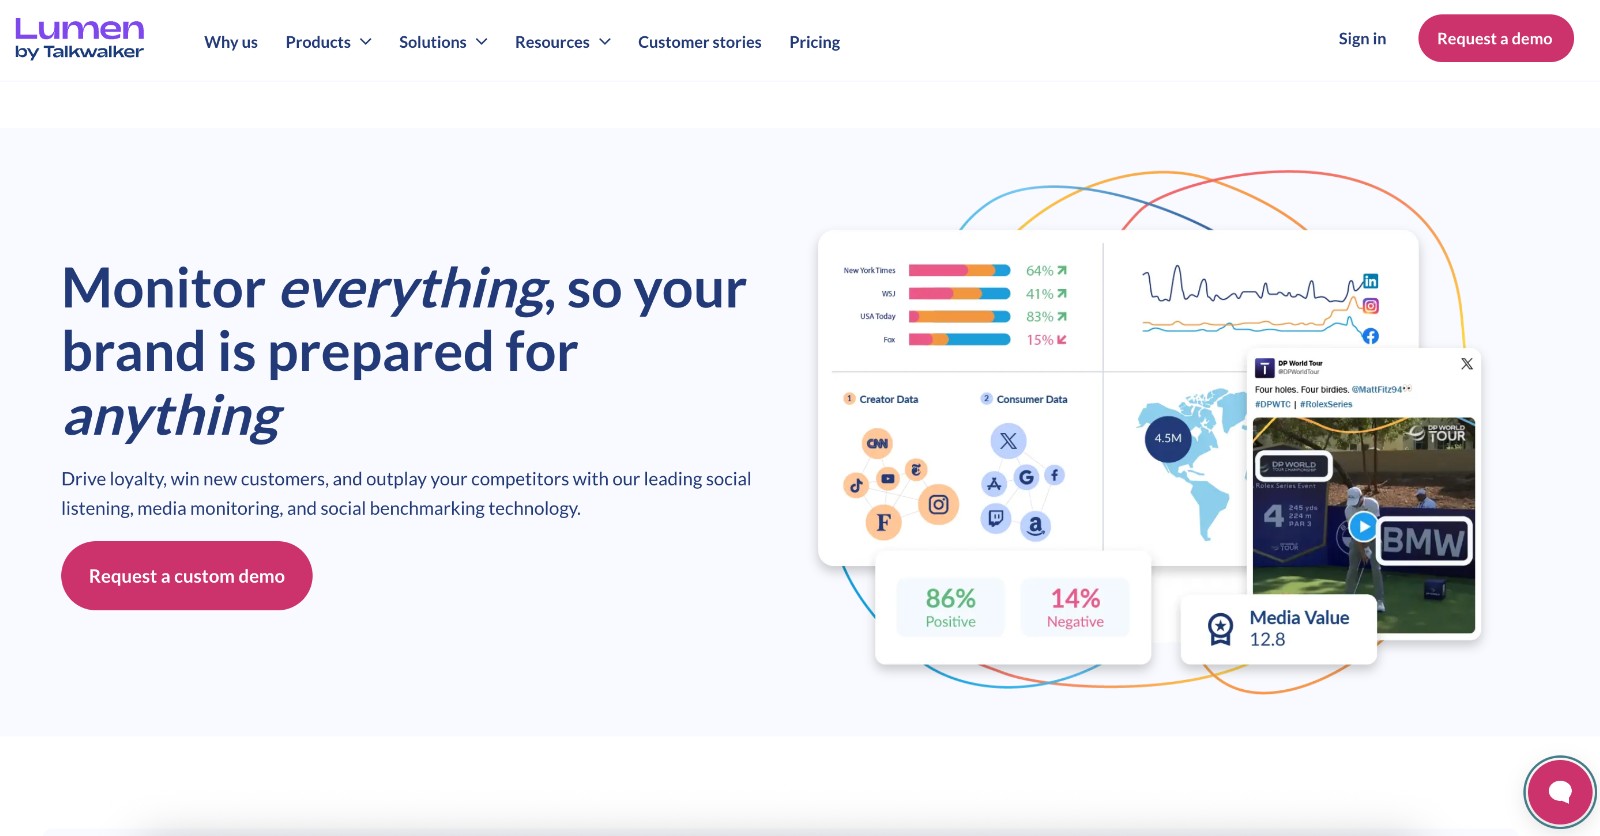
Talkwalker renamed itself Lumen by Talkwalker in 2026, in its own words “reflecting our next chapter as we bring Hootsuite and Talkwalker closer together”. Same platform, new sign – and it now also powers Hootsuite’s listening.
Its billing model is genuinely different from everything else here – unlimited users on every plan, with the meter on topics, filters, channels and non-sampled data volume instead. Analyze doubles your data volume over Core, Business gives six times and adds historical depth.
The numbers: no published price. Its free tools give 7 days of history; paid goes up to 5 years of back data.
12. Social Status
Best for: analytics only, with one of the few genuinely permanent free tiers here.
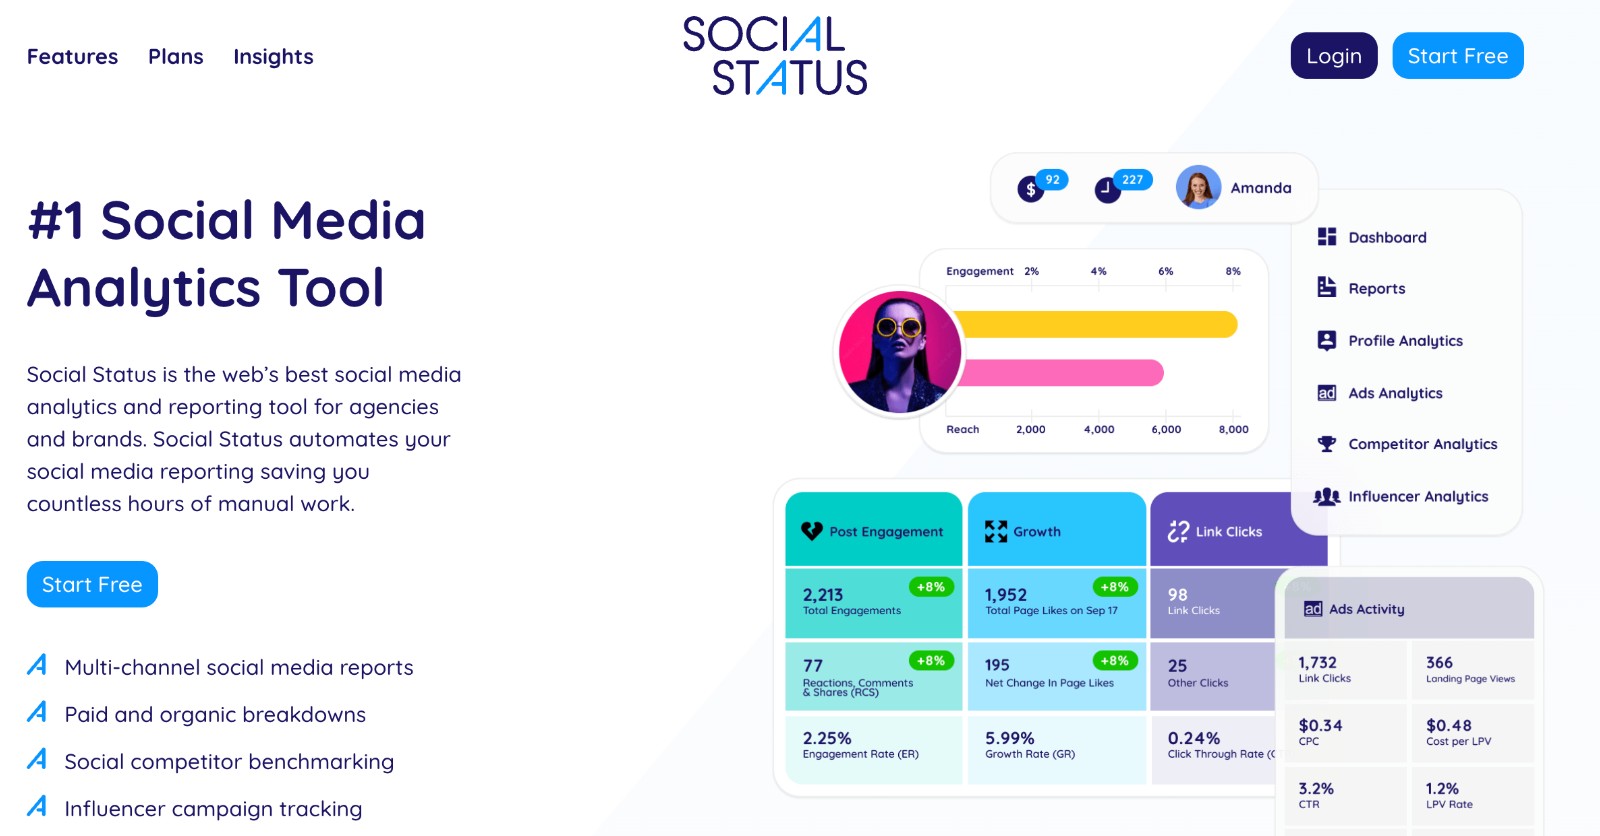
Social Status does one thing: it measures. Profiles, ads, competitors and influencers, paid and organic side by side, and nothing at all in the way of publishing – which is the point. The pricing is metered by “plan quota”, where a competitor costs you exactly the same as one of your own profiles.
It also runs the cleanest history ladder in the category, and it is the clearest illustration of retention as a pricing lever anywhere: 1 month free, 2 months at $9, 3 at $29, 6 at $49, a year at $99, two years at $399, three at $799.
The numbers: Free forever, 1 quota unit, 1 month of history, 3 users. Micro $9/mo. Basic $29/mo, and the cheapest white-label on this list at that price, replacing the Social Status logo in PDF and PPTX footers. API from Gold at $399.
13. Brand24
Best for: watching mentions when the budget is real but not enormous.
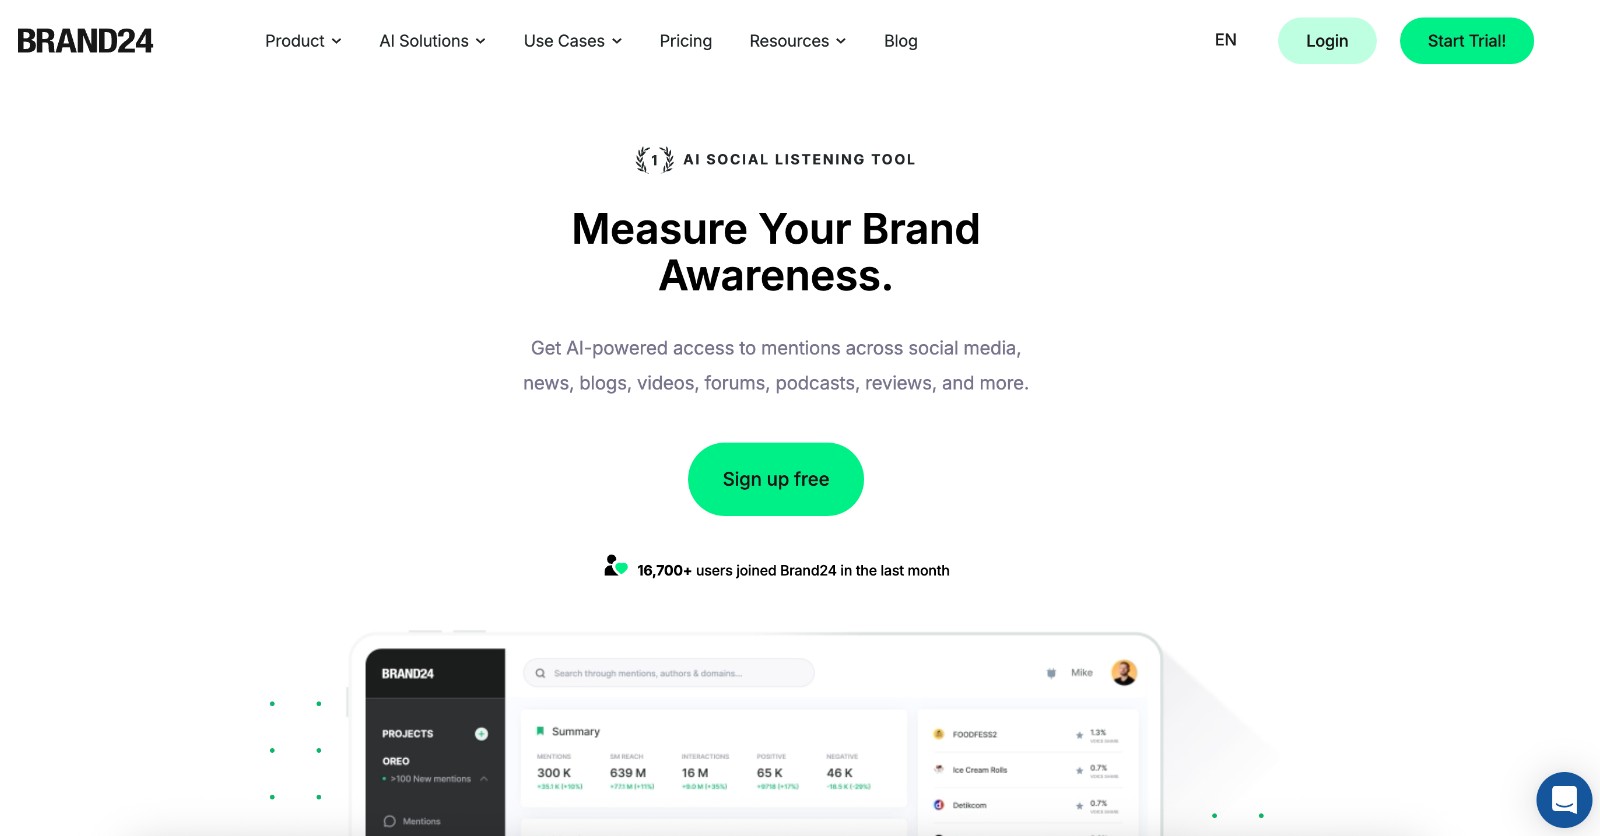
Brand24 is a mention-monitoring tool with sentiment, and its per-keyword billing means unlimited users from the Team plan up. For a marketing team that wants to know when it gets talked about, it does the job without a sales call.
Its history is one of the shortest here and the vendor says so flatly: “No older than 30 days, with the exception of special cases.” A new project gets a sample of the previous 30 days and nothing more. If you need to reconstruct what happened last quarter, this is not the tool.
The numbers: Individual $199/mo annually or $249 monthly, 3 keywords, 2,000 mentions. Team $299/$349, 7 keywords, unlimited users. Pro $399/$499 and the first tier with white-label reports. API is an extra fee until Enterprise. 14 days free, no card.
14. Mentionlytics
Best for: multilingual monitoring on a small budget.
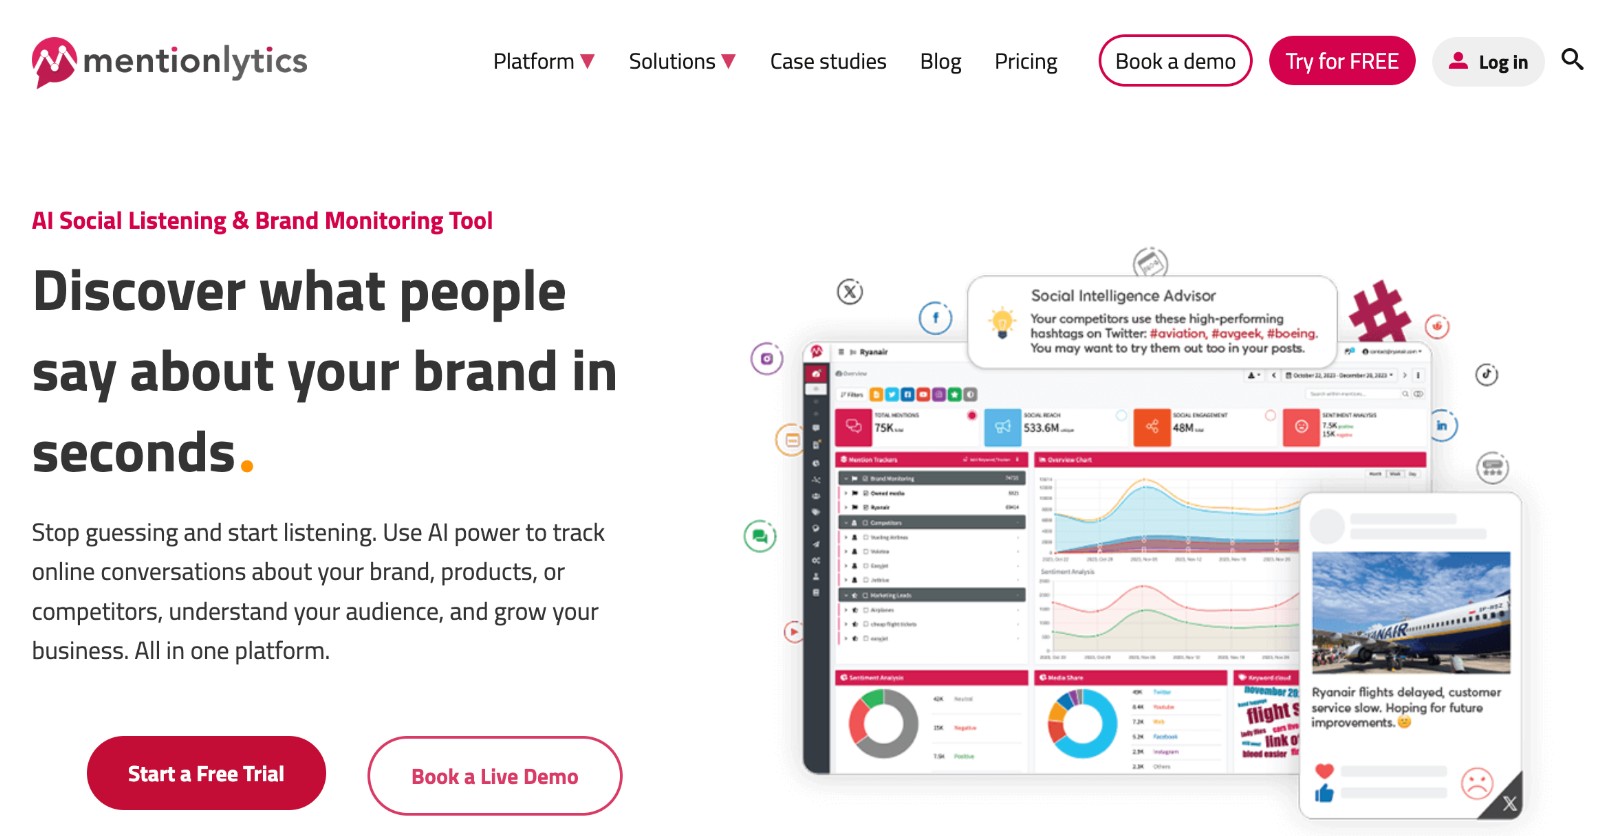
Mentionlytics starts at $29 a month, which makes it the cheapest genuine listening product here, and it handles languages that most of the category quietly ignores.
The detail that ought to be famous: the archive is 18 months on every single plan, including the $29 one. Almost every other vendor on this page turns history into a paywall. Mentionlytics simply doesn’t – anywhere. All plans also include sentiment analysis, PDF and Excel export and up to 10 users.
The numbers: Startup $29/mo, 3 keywords, 1,000 mentions a month. Essential $99/mo, 8 keywords, 15,000 mentions. Pro $299/mo, 25 keywords, 60,000 mentions, and the first tier with white-label. Trial with no card, length not stated.
15. BuzzSumo
Best for: researching content rather than measuring your own.
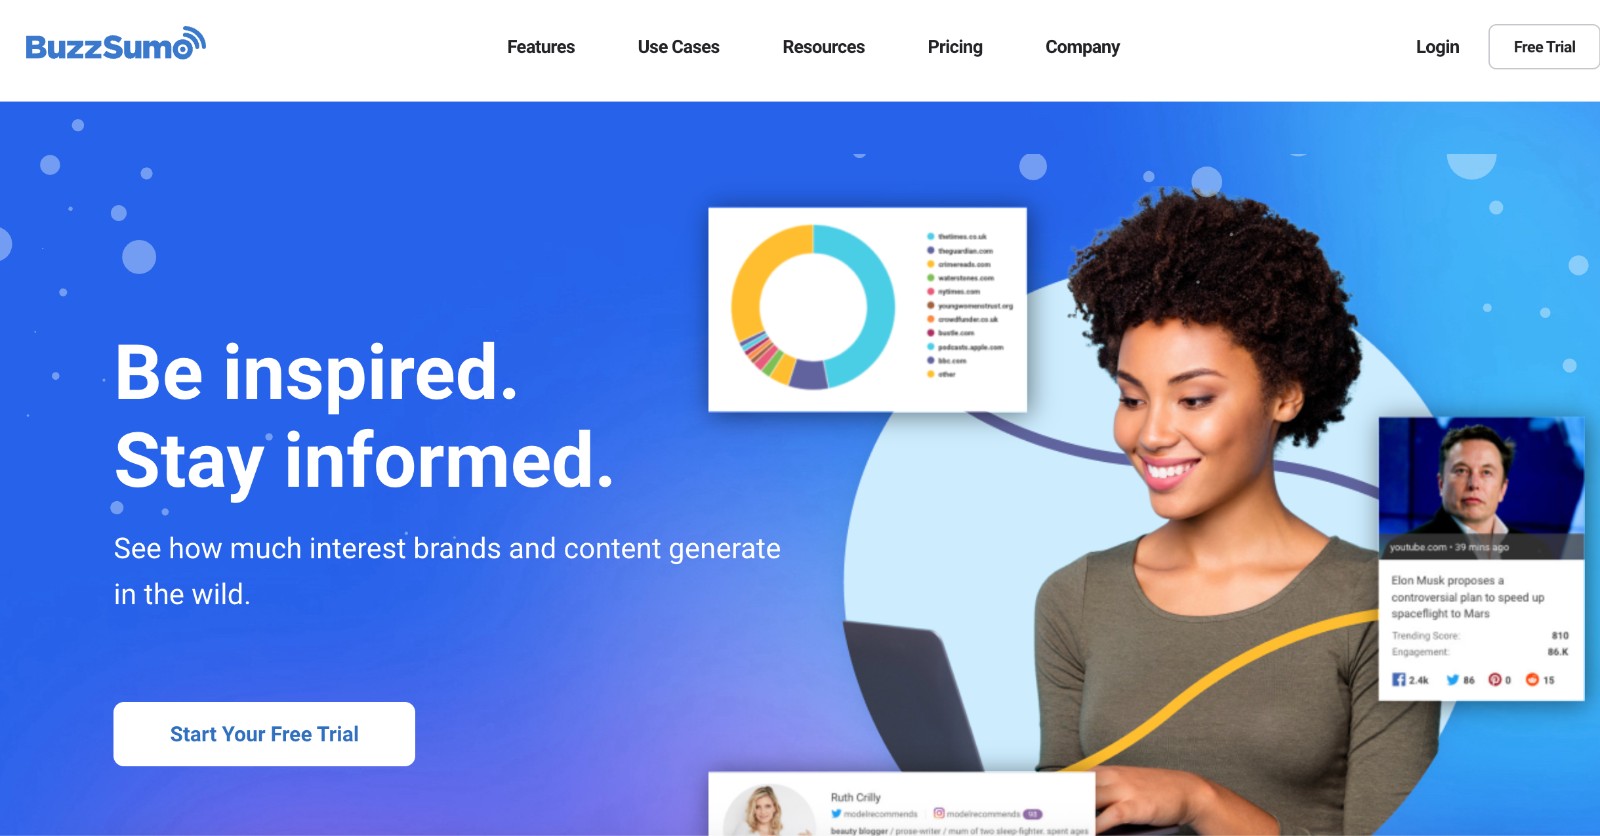
BuzzSumo indexes public content instead of connecting to your accounts, which flips the usual problem on its head: there is no backfill question, because the history is already there on day one. Two years of it on the entry plan, up to five higher up.
It is a research tool – not a reporting tool. You will not build a client dashboard in it. What you will do is find out what got shared in your category and who shared it.
The numbers: Content Creation $199/mo billed yearly, 1 user, 2 alerts, 2 years of data. PR & Comms $299/mo. Suite $499/mo with 5 years. Enterprise $999/mo, annual only. No free plan and the trial length isn’t published, though it’s capped at 50 searches.
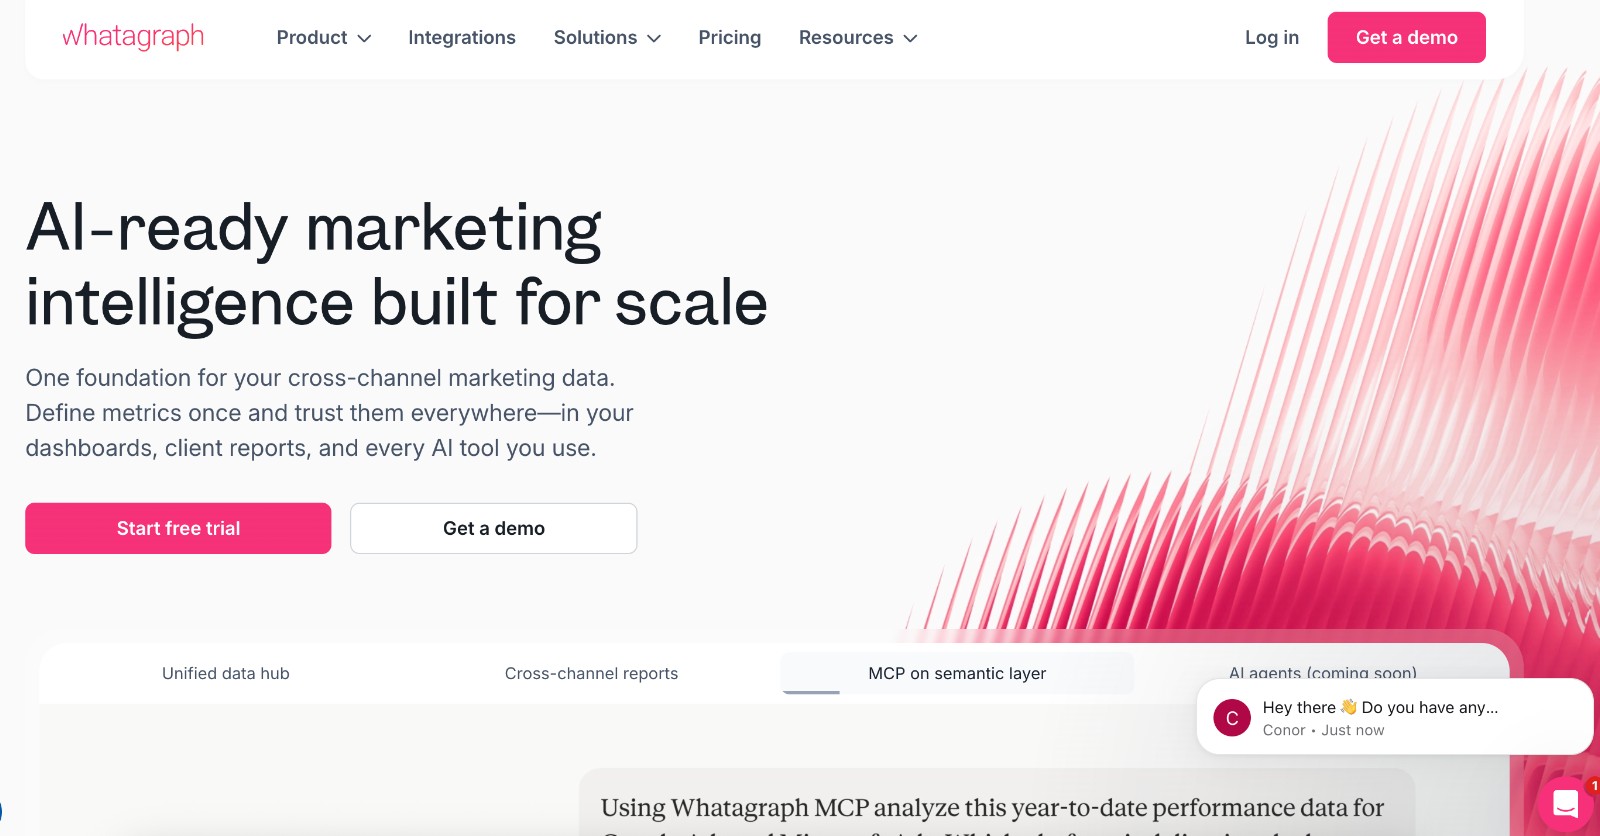
16. Whatagraph
Best for: agencies pulling many data sources into one client report.
Whatagraph is a reporting layer rather than a social analytics tool, and it does that job well: dozens of connectors, unlimited users, unlimited reports, and a push into BigQuery for teams with a warehouse.
Two hard facts before you shortlist it. It moved sharply upmarket and now publishes exactly two plans, starting at €699 a month with no monthly billing option at all. And the historical data situation is the worst in this guide: for Instagram Business, LinkedIn and Pinterest Organic you get nothing on connect, in the vendor’s words “you will be able to generate reports for any period starting from the moment you add your account”. White-label is included, but the custom domain is a Prime-tier add-on.
The numbers: Max from €699/mo, billed annually, 50 source credits. Prime custom. 14-day trial.
17. DashThis
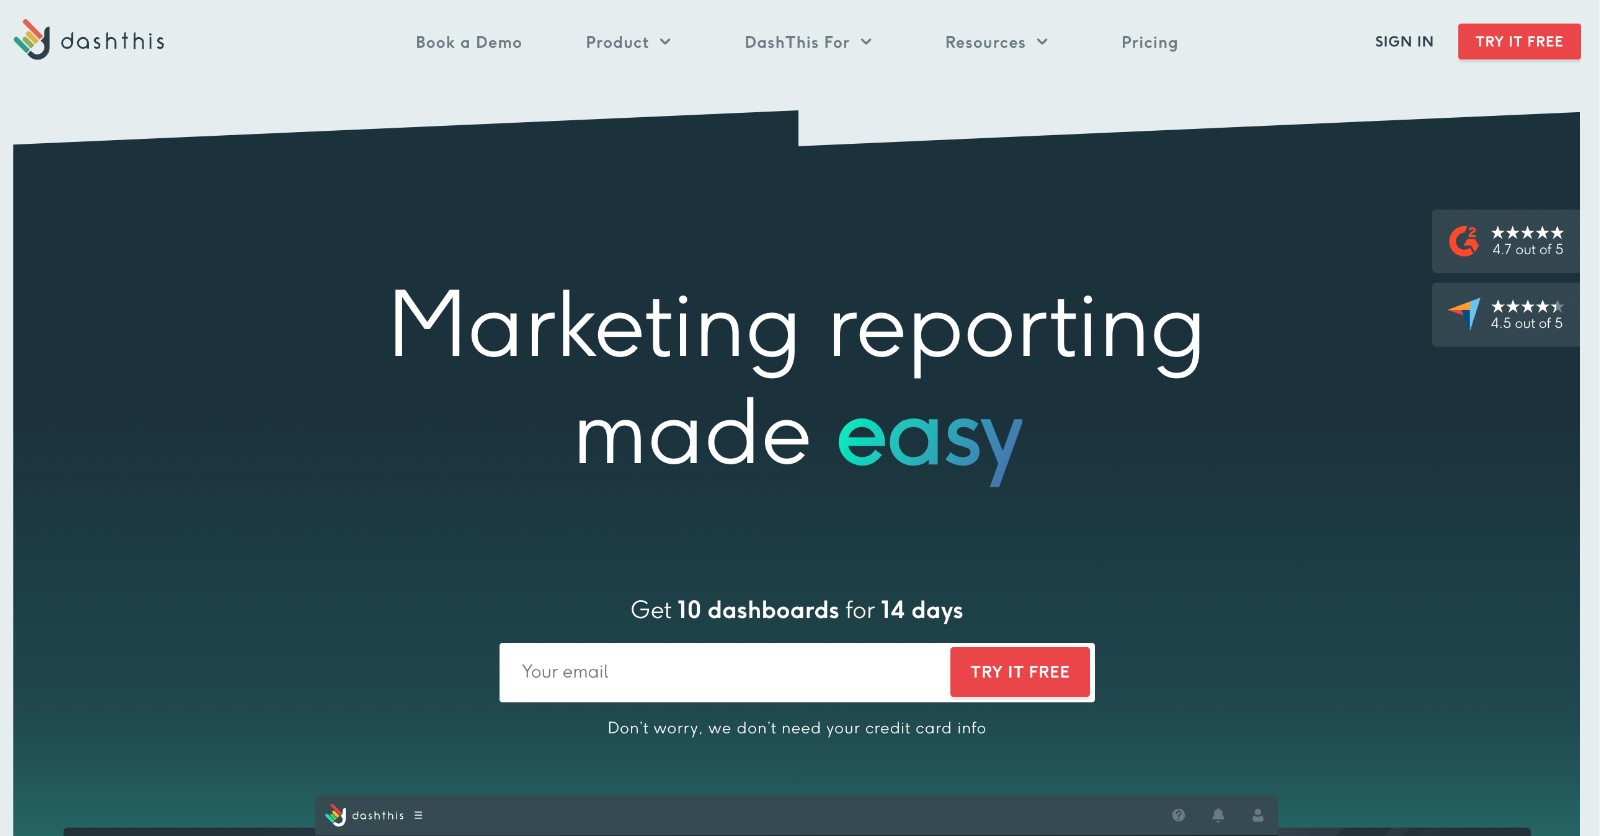
Best for: white-label client dashboards at a price that isn’t silly.
DashThis is the answer to a narrow question asked very often by agencies: how do I put fifteen data sources on one dashboard, brand it as mine, and send it from my own domain without paying enterprise money.
It is the only tool in this guide where logo, no vendor branding and a custom domain all come on the entry plan, at $44 a month. Everyone else either charges more or holds the domain back. History is 13 months regardless of tier, and users are unlimited on every plan because the meter is dashboards and data sources.
The numbers: Individual $44/mo, 3 dashboards, 15 sources. Professional $139/mo, 10 and 40. Business $279/mo. AI Insights Pro is a $19/mo add-on. 14-day trial.
18. Zoho Social
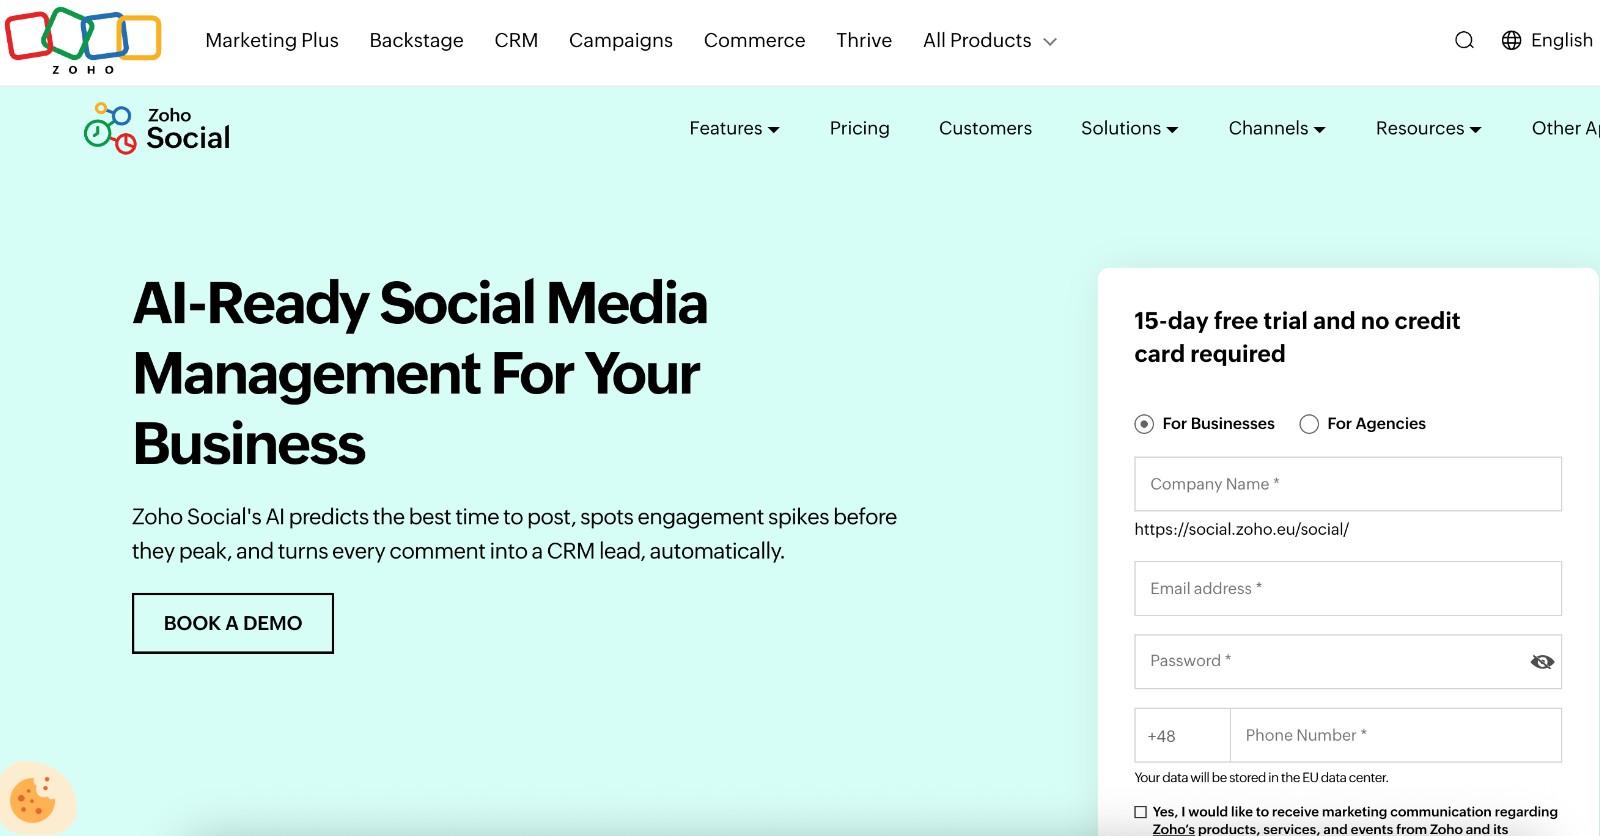
Best for: the cheapest paid reporting that is still worth having.
At $10 a month on annual billing for a whole brand, very little here competes, and the free tier is permanent rather than a trial in a costume.
Read the history ladder before you sign, because Zoho is the clearest example in this guide of retention as a pricing lever: on first connection you see the past 65 days, but what your reports can actually reach is 15 days on Standard, three months on Professional, and a year on Premium and above. At $10 a month you are buying a fortnight of memory.
The numbers: Free forever, 1 brand, 6 channels, 1 member. Standard $10/mo annually. Professional $30. Premium and Agency add members, brands and the full year of history. 15-day trial, no card.
19. Sendible
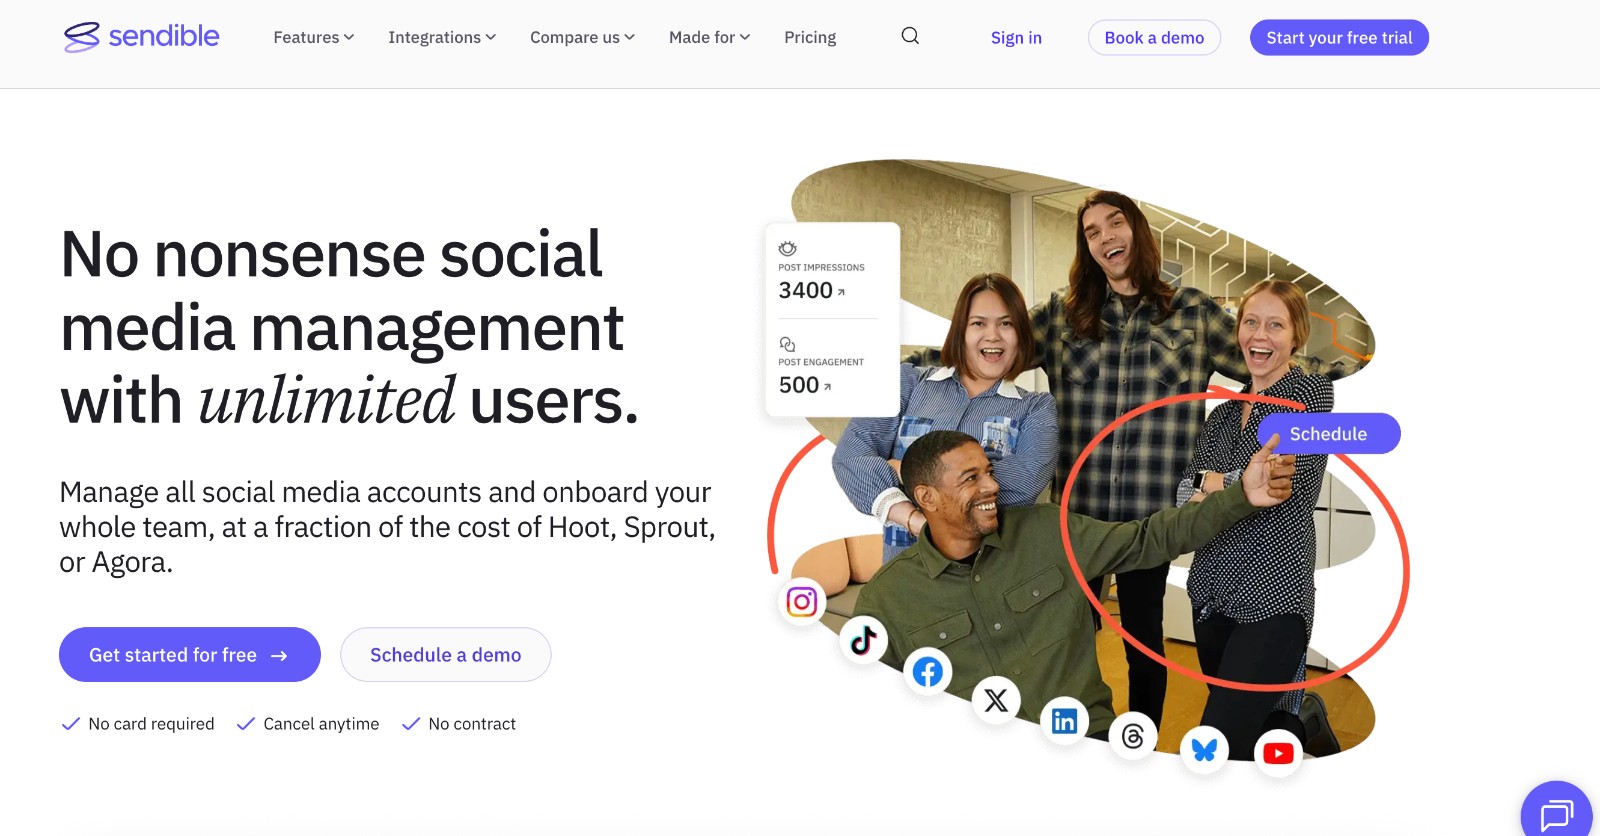
Best for: agency reporting where the head count keeps changing.
Sendible includes unlimited users on every plan and builds its reporting around client workspaces, which is the right shape for an agency and an unusual one at this price. Reports are drag-and-drop, schedulable and brandable – and they cost you nothing per head.
Its capacity meter is the workspace, sold in blocks of six profiles, so a client with eight profiles costs you twelve. Sendible also rebuilt its entire plan lineup on 18 August 2026, so anything you read about its tiers from before that date is describing plans that no longer exist.
The numbers: Core $29.75/mo billed yearly, 1 workspace, 6 profiles, unlimited users. Plus $84.15, 3 workspaces, 18 profiles. 14-day trial, no card.
20. Siftsy
Best for: understanding what the comment section is actually saying.
Siftsy is the newest idea on this list and the only pure-play comment intelligence tool: it reads comment sections across Instagram, TikTok, Facebook, YouTube, LinkedIn and X and returns sentiment, recurring themes and the comments worth reading. Buffer put it at number five in its own analytics listicle, which tells you the category is starting to take the idea seriously.
It bills per post credit and per seat, so it isn’t comparable to anything else here on price. Historical lookback is 24 months on the entry tier, 72 months above it, and lifetime on Enterprise.
The numbers: Growth, Powerhouse and Enterprise, all “contact sales”, no published price. Growth includes 350 monthly post credits and 5 seats.
Named elsewhere, and why they’re not here
Keyhole appears in eleven of the fourteen listicles currently ranking for this phrase, and it is no longer sold on its own: keyhole.co/pricing redirects to a Muck Rack demo form after Muck Rack acquired it in 2024, and social listening is now an add-on to a quote-only PR suite. Audiense has merged with Elevar and Buxton, and the only prices on its site now belong to a Shopify tracking product. Quintly is being folded into Facelift Data Studio, in Facelift’s words “gradually reduce, revealing one premium synchronized MarTech solution”.
Meltwater publishes no prices, no trial and a 12-month minimum contract. Dash Social, SocialPilot, Vista Social and Google Analytics 4 are all reasonable and all better covered elsewhere.
In-depth social media analytics & reporting tools
Analyze your performance across different social media platforms. Generate reports for your own profiles and your competitors’, too – with an all-in-one social media tool.
How far back your data actually goes
This is the section that should exist on every page about social media analytics tools and exists on almost none of them.
Two different numbers matter, and vendors tend to publish neither clearly.
Retention is how far back the tool will let you look on the plan you bought. Backfill is how much history it collects on the day you connect an account. A tool can have generous retention and no backfill at all – which means it will happily store three years for you starting from next Tuesday.
Here is what the vendors publish, in their own words:
| Tool | History on the entry plan | Does it change by tier? |
|---|---|---|
| NapoleonCat | ~2 months pulled in automatically for Facebook and Instagram on connect | Up to 24 months on request, $5 one-off per month scanned |
| Brand24 | 30 days. “No older than 30 days, with the exception of special cases” | No |
| Zoho Social | 15 days on Standard | Yes: 15 days, 3 months, then 1 year |
| Social Status | 1 month free, 2 months at $9 | Yes: 1 month up to 3 years |
| Socialinsider | 3 months | Yes: 3, 6, 12 months |
| Rival IQ | 6 months | Yes: 6, 12, 24 months |
| Hootsuite (listening) | 7 days on Standard | Yes: 7 days, then 30 |
| DashThis | 13 months | No |
| Mentionlytics | 18 months on every plan, including the $29 one | No |
| BuzzSumo | 2 years | Yes: 2, 3, then 5 years |
| Siftsy | 24 months | Yes: 24 months, 72 months, lifetime |
| Brandwatch | Archive back to 2010 | Listen loads 1 year, 2 with an add-on |
| Lumen by Talkwalker | Up to 5 years on paid, 7 days on the free tools | Yes, Business adds depth |
| Whatagraph | Nothing at all on connect for Instagram Business, LinkedIn and Pinterest Organic | No |
Retention is a pricing lever and almost nobody says so out loud. Zoho at $10 a month gives you a fortnight of memory. Rival IQ charges $320 more a month to move from six months to twenty-four. When you compare two tools on price, compare the history you get for that price or you are not comparing the same product.
The day you connect is day zero
Now the part that costs people real money, usually about eleven months after they sign up – the first time somebody asks for a year-on-year chart.
Most social networks will not hand a third-party tool your history – full stop. So when you connect a profile, a good tool grabs whatever the API allows and starts counting from that moment. Follower history, in particular, is almost never recoverable – not by anyone, at any price.
The vendors who say this plainly deserve credit for it:
- Socialinsider: “due to API limitations from all social platforms, we start gathering followers’ insights from the day the profile is added to Socialinsider. Because of these limitations, we cannot get the numbers for dates in the past.”
- Rival IQ: “Once a social media profile has been added, Rival IQ will track the number of followers moving forward, but it will never have follower counts prior to when the handle was added to the database.”
- Whatagraph: “Your performance data will be building up each day, and you will be able to generate reports for any period starting from the moment you add your account to Whatagraph.”
- Brand24: a new project receives “a sample set of data from the last 30 days”.
- Sprout Social, on competitors specifically: “For most Competitor Report data, Sprout can’t backfill historical data based on network limitations.”
- Sprinklr: “Instagram Follower metric cannot be backfilled (API Limitation).”
What does get backfilled varies enormously, and Sprout publishes the most complete map of it anywhere: Facebook profile metrics two years but only the last 500 posts; Instagram up to 90 days for most metrics but only 30 days of follower count, and only as far back as the day the account became a Business account; Instagram Stories, nothing; X audience metrics, nothing; LinkedIn, the last 90 days of posts; TikTok, 60 days on connection; Pinterest, nothing; YouTube, 30 days at first and then up to two years within three days.
So here is the single most useful thing in this guide. If there is any chance you will want to report on a profile later, connect it to something today. A free tier will do – it costs nothing and starts the clock. The clock starts on connection day, and the follower history you don’t collect now is gone for good.
This is also the one number worth checking tool by tool before you commit, because it is where the differences are largest and least advertised.
Here are ours, since we are on the list. Connect a Facebook or Instagram profile to NapoleonCat and it pulls in about two months of history straight away, although on Instagram the follower numbers only reach back 30 days. TikTok arrives with 7 days of stats and 60 days of posts, and no follower history at all, because TikTok does not hand it over.
LinkedIn and YouTube start from zero on the day you connect, for the same reason. Need more than that? We can go back up to 24 months for a one-off $5 per month scanned.
Everything after that is gathered from the moment the account is connected, and that is worth saying plainly rather than burying it. The Facebook follower count tracker and the Instagram followers count history build day by day from connection day, which is the difference between knowing you lost people in March and knowing you lost them the afternoon the campaign went out.
One more detail worth knowing: two reputable vendors publish different LinkedIn backfill windows for the same API, one saying a year of profile metrics and 90 days of posts, another saying about 180 days. Neither is lying – it depends on when they built the integration and what they cached. Which is a good reason to test on your own accounts during the trial rather than trusting anybody’s table, including this one.
What the networks actually let a tool measure
Half the disappointment in this category is a tool being blamed for a limit the network set. These are from the platforms’ own developer documentation – not from vendors describing them.
Instagram. Meta states: “User Metrics data is stored for up to 90 days” and “some metrics are not available on Instagram accounts with fewer than 100 followers”. Aggregated fields exclude ads-driven data. Stories generate no data at all unless at least five unique users saw them, and EEA user activity is excluded from Story replies for privacy reasons.
LinkedIn. Post statistics come back “only within the past 12 months using a rolling 12-month window”, and time-bound statistics are not supported for specific posts, which means per-post LinkedIn numbers are lifetime totals only. You cannot ask how a post performed in Q1 – the endpoint will not answer. Page-level statistics return views and clicks, not impressions or reach, so “LinkedIn organic reach” in a dashboard is really post-level share data.
TikTok. Its Research API is closed to commercial users outright. New videos take up to 48 hours to appear and statistics can take up to ten days to settle. Reach and watch time stop returning data once a video has been inactive for about seven days, and personal accounts get no daily follower gain or loss at all.
X. The API moved to pay-per-use credits. A post read costs $0.005, a user lookup $0.010, and posting something containing a URL costs $0.200, forty times a plain read. Reads are capped at three million a month. This is why X coverage keeps thinning across the category and why anyone offering deep historical X data charges for it.
YouTube. Metrics take 24 to 72 hours to reconcile with what you see natively, so a tool disagreeing with YouTube Studio this morning is usually just early – not wrong.
If your dashboard and the native app disagree by five or ten percent, that is normal. API sampling, time zones and different definitions of an interaction all contribute. Validate anything you are about to put in front of a client against the native numbers first – every time.
Is that competitor data real, or just public maths?
Competitive benchmarking is the single biggest reason people buy an analytics tool rather than using the free native dashboards. It is also the most overhyped feature in the category – by some distance.
Meta’s public discovery endpoint returns exactly this about an account you don’t own: follower count, media count, and per-post comments, likes and views. That is the entire list. No reach. No impressions. No saves. No story completion. No audience demographics. Nothing about age-gated accounts at all.
So when a tool shows you a competitor’s “engagement rate”, it is dividing public likes and comments by public followers. That is a genuinely useful number – and it is not the same kind of data as your own reach. Any vendor implying they can see a competitor’s impressions is describing something the API does not return.
Rival IQ is refreshingly direct about the split – calling one bucket “Your Private Data” and the other “Competitive Public Data”, and publishing the caps: the last 3,200 results on X, up to 2,000 on Facebook and Instagram, 1,000 on YouTube and TikTok.
Where competitor data is genuinely rich is in the things that are public by definition: how often they post, when, in which formats, which posts landed, which hashtags earned engagement, and how quickly they answer their own comment section. NapoleonCat, Rival IQ and Socialinsider all do that well.
What happened when Instagram killed Impressions
If you want one story that explains why this whole section matters, it is this one.
On 21 April 2025, in Graph API v22.0, Meta deprecated the Instagram Impressions metric and replaced it with Views, which now includes replays. Within weeks, Metricool, Iconosquare, Emplifi, Brandwatch, Zoomph and Pressboard had all published help-centre notices about it.
The consequences are still with us. Accounts that were connected before the change kept their stored impressions data. Accounts connected afterwards show Impressions as zero, permanently, because the API no longer returns the field. And because Views counts replays and Impressions did not, year-on-year comparisons across that date are not comparing the same thing.
One API change, every dashboard in the category, one afternoon – and it will happen again. When you are choosing a tool, it is worth looking at how quickly and how honestly the vendor communicated that one.
Free social media analytics tools, honestly sorted
Search “free social media analytics tools” and you get two very different things dressed as one. Here is the split.
The native dashboards, which are free and better than people admit. Meta Business Suite, Instagram Insights, TikTok Analytics, LinkedIn Page Analytics, YouTube Studio, Pinterest Analytics and X Analytics all give you more depth on their own platform than any third-party tool can, because they are not going through an API. What they cannot do is put two networks in one view, keep history beyond the platform’s own window, or produce a client report. If you run one or two profiles and nobody asks you for a PDF, use them and spend the money elsewhere – seriously.
Permanent free tiers from paid tools, which buy you cross-network reporting at small scale:
| Tool | What the free tier gives you |
|---|---|
| Social Status | 1 profile, 1 month of history, 3 users, Facebook, Instagram and YouTube |
| Metricool | 1 brand, 30 days of analytics, no LinkedIn and no X |
| Zoho Social | 1 brand, 6 channels, 1 member |
| Iconosquare | 2 profiles, 1 user, 10 posts a month per profile |
| Buffer | 3 channels, 1 user, basic post analytics |
And the tools where “free” means a trial: NapoleonCat, Sprout Social, Hootsuite, Rival IQ, Socialinsider, Brand24, Mentionlytics, Whatagraph, DashThis, Sendible. Between 14 and 30 days, mostly without a card.
There is one non-obvious reason to start a free tier even if you plan to buy something else later, and it is the point made further up: connecting a profile starts its history. A free Social Status or Metricool account collecting follower data from today costs nothing and will be worth something in six months.
Social media reporting tools: branded, white-label, and what each one costs
“White-label reporting” appears on nearly every pricing page in this category and means at least three different things – so check which one you are buying.
- Branded is your logo on the vendor’s template. Common, cheap – usually enough.
- White-label is your logo and no trace of the vendor. Less common than advertised, by a lot.
- White-label with a custom domain means the client receives the report from your address, on your domain, and never learns which tool you use. Rare – and usually the expensive tier.
Where each tool lands:
| Tool | Cheapest plan with genuine white-label | Custom domain? |
|---|---|---|
| DashThis | Individual, $44/mo | Yes, included on every plan |
| Social Status | Basic, $29/mo, logo replaces theirs in PDF and PPTX footers | No |
| NapoleonCat | Your own logo on reports | Not published |
| Rival IQ | Engage, $349/mo, and it’s branding rather than white-label | No |
| Brand24 | Pro, $399/mo annually | Not published |
| Mentionlytics | Pro, $299/mo | Not published |
| Zoho Social | Agency plan | Not published |
| Buffer | Team plan, branded PDF export | No |
| Whatagraph | Max, €699/mo | No, Prime add-on only |
The pattern matters if you are an agency: a $44 tool beats a €699 one on the thing agencies actually need.
Analytics for what happens in the comments
Every tool above measures the feed. Reach, impressions, engagement, follower growth: how your content performed.
There is a second kind of social analytics that barely appears in any comparison, and for a lot of teams it is the half that gets asked about in the Monday meeting. How many comments and messages came in. How fast did we answer. Who on the team is carrying the load. How much of it was spam we hid. Whether the mood in the replies is getting better or worse.
Sprout Social has an entire separate article about these metrics and keeps them out of its analytics listicle. Agorapulse publishes a whole feature page on Community Management Reports and gets described by every listicle as a scheduling tool with ROI reporting. The measurement layer for conversation is real, documented by the vendors themselves, and invisible in this category’s content.
Where to look if this is your problem:
- NapoleonCat puts response times and comment volumes next to the content results in the same report, tracks how much was replied to, hidden or deleted by Auto-moderation, and adds inbox sentiment. Moderation reporting is the point of the product – not a tab.
- Agorapulse Community Management Reports cover response time by team member and items reviewed, hidden and deleted.
- Sprout Social Case Management and Case Team Activity Reports give first reply time, average handling time and SLA adherence, on the higher tiers.
- Statusbrew reports team response times and identifies top performers.
- Siftsy does the other half of it: what the comments actually say, by theme and sentiment.
If your reporting has a hole where “are we keeping up” should be, that list is the answer, and it is a much shorter list than the one at the top of this page.
How we put this together
Every price and every capability claim here was read on the vendor’s own pricing page or help centre, not taken from another listicle. Where a vendor publishes no price, we say so – rather than repeating a third party’s estimate. Where a vendor’s own pages contradict each other, we say that too. Platform limits come from the developer documentation of Meta, LinkedIn, TikTok, X and Google rather than from vendors describing them.
Three tools that appear on other 2026 lists were checked and left out because they are no longer sold as described: Keyhole, Audiense and Quintly.
Social media analytics tools: your questions, answered
What are social media analytics tools?
Software that collects performance data from your social accounts and turns it into metrics, dashboards and reports. Social media analysis, in other words, done for you rather than in a spreadsheet. Most cover reach, impressions, engagement, follower growth and top posts across several networks at once, which is the main thing the native dashboards can’t do. You’ll see the category sold as social media analytics software, social media analytics platforms, a social media analysis tool, social media reporting software, social media measurement tools or just social analytics tools.
Same job, different shelf.
What’s the difference between analytics tools and social media management tools?
A management tool is built to do the work: publish, reply, moderate, assign. We compare those separately in our guide to social media management tools. An analytics tool is built to measure it, and often has no publishing at all. Rival IQ, Brandwatch and Social Status cannot post anything. Plenty of teams end up with one of each, which is fine – as long as you’re honest about paying twice.
What are the best free social media analytics tools?
The native dashboards, first: Meta Business Suite, Instagram Insights, TikTok Analytics, LinkedIn Page Analytics and YouTube Studio are free, deep and accurate. For cross-network reporting for free, Social Status, Metricool, Zoho Social, Iconosquare and Buffer all run permanent free tiers, all limited to one or a few profiles. If you want social media reporting tools free of charge at agency scale, they don’t exist – the free tiers stop at one brand.
How far back do social media analytics tools go?
It varies by a factor of nearly two hundred across this list, from Brand24’s 30 days to Brandwatch’s archive back to 2010, and it very often depends on which plan you bought. Zoho gives 15 days on its entry plan and a year on Premium. Socialinsider gives 3, 6 or 12 months. Rival IQ gives 6, 12 or 24. Always check history against the specific plan you’re pricing – not against the vendor’s homepage.
Will a tool import my past data when I connect an account?
Partly, and less than you’d hope. Post data is often backfilled for a year or two. Follower history usually is not, because the platform APIs don’t return it. Several vendors state this plainly, including Socialinsider and Rival IQ. Whatagraph gives no history at all on connect for Instagram Business and LinkedIn.
Can these tools track my competitors?
Yes – within a hard limit: for accounts you don’t own, the platforms expose follower counts, post counts, likes, comments and views, and nothing else. No reach, no impressions, no demographics. Competitor posting frequency, formats, timing, top posts and hashtags are all fair game and genuinely useful.
Why don’t the numbers match Instagram’s own app?
Usually one of four reasons: API sampling, time-zone boundaries, different definitions of an interaction, or a metric that changed. Discrepancies of five to ten percent are normal. A discrepancy of a hundred percent usually means a metric was deprecated, which is what happened to Instagram Impressions in April 2025.
What are the best social media reporting tools for agencies?
Look for genuine white-label rather than branding, a custom domain if your clients shouldn’t see the vendor, scheduled delivery, and unlimited users so reviewers don’t cost a seat. DashThis is the cheapest that does all four. Sendible and Zoho Social’s Agency plan are strong on client separation.
How much do social media analytics tools cost?
Real analytics starts around $9 to $30 a month for one or two profiles, $80 to $250 for a proper multi-profile setup with benchmarking, and enterprise listening from Brandwatch, Lumen by Talkwalker or Meltwater is quote-only with annual contracts. The entry price is the least useful number – check the history, the profile count and the competitor slots that come with it.
How do I track social media analytics across several platforms at once?
Connect each profile to one tool and read them in a single dashboard. That is the whole reason third-party social media analytics tools exist, because no native dashboard will show you Instagram and LinkedIn side by side. If you want a social media analytics tools comparison that goes past the feature grid, compare three things: history on your plan, competitor slots on your plan, and whether the report is white-label.
Are there tools that analyse an audience rather than content?
Yes, and they are a different thing. Audience analytics tools like SparkToro segment who follows you and what else they care about, rather than how a post performed. Most of the tools in this guide give you basic audience breakdowns – country, city, age, gender – and stop there.
Which social media metrics actually matter?
It depends who’s asking. For content, engagement rate by post type and best posting time change what you do next week. For growth, follower growth and reach trend. For service, response time, reply volume and sentiment. Pick the three someone will act on and ignore the rest, because every tool here will happily give you two hundred.
Do I need social listening as well as analytics?
Only if you need to know what people say when they don’t tag you. Free social media monitoring tools exist – Talkwalker Alerts and Google Alerts among them – and they will tell you that a mention happened, not how many or how people felt about it. Analytics measures your accounts; listening scans the open web. Listening is genuinely expensive to run, which is why it’s an add-on nearly everywhere and a separate product at Hootsuite and Sprinklr.
Can I get social media analytics into Looker Studio or a data warehouse?
Yes – and it’s usually a paid extra. Socialinsider charges $100 a month for API access and another $100 for its Looker Studio connector. Whatagraph pushes to BigQuery on its Prime tier. Social Status includes API access from its Gold plan at $399. Buffer and most publishing-first tools don’t offer one at all.
In-depth social media analytics & reporting tools
Analyze your performance across different social media platforms. Generate reports for your own profiles and your competitors’, too – with an all-in-one social media tool.