Social media marketing is currently a vital element of almost every marketing strategy. Regardless of whether you work for a marketing agency, as a brand’s marketing manager, or run your own company – at some point, you will have to deal with analyzing your social media results.
That’s why comprehensive social media reporting is essential – the better your reports, the more insights you can drive from them.
In this article, we’ll take a close look at how to create in-depth, fully customizable Facebook social media reports as well as Instagram social media reports in a matter of minutes, and how to use them to improve your business.
Why are Facebook and Instagram analytics so important?
If you run marketing communications on Facebook and Instagram, you already know that there is no simple way to succeed.
To make your actions successful, you need to constantly monitor and assess your progress in order to make the necessary adjustments.

In-depth Facebook and Instagram Analytics Reports
Generate comprehensive social media reports in seconds. Schedule weekly, monthly, or quarterly reports – with an all-in-one social media tool.
To put it simply: effective social media marketing is a process of constant improvement. And in order to effectively track your progress, you need to implement some form of reporting or another.
But the benefits of reporting go beyond that. Let us identify the most important ones:
Social media reporting helps you to discover your strategy’s strengths and weaknesses
Social media reporting is a great tool for assessing the effectiveness of your marketing strategy.
The reports are a great source of knowledge about your overall performance and your audience’s attitude towards your communications.
Thanks to this information, you’ll be able to see how the different types of posts perform and, in effect, cut down on the weak ones while putting more focus on those that give the best results!
Social media reports facilitate transparency between you, your team, and your stakeholders
Depending on your position, it can be your team, your supervisor, a client, or an investor who wants to see if cooperation with you is bringing in the desired results.
There is no better way to prove the quality of your work than with data-based, comprehensive reports. With a well-prepared social media analytics report, you’ll be able to show your stakeholders that what you do has a positive influence on the company.
Now you’re probably thinking: OK, social media reporting is important – but how do I know what metrics I should be tracking? Read on to learn what are the key social media marketing metrics!
Key social media analytics metrics
Measuring social media marketing performance is a great source of information both about your target group and the effectiveness of your communications. But every business is unique, so it is crucial to choose the right metrics to track.
Regardless of the niche you operate in, there is a set of social media-specific metrics that are relevant for most businesses.
Let us quickly explain the key social media marketing metrics that every marketer should track:
What is social media reach?
This metric tells you how many people have seen your content. Reaching a broad audience with your communication is substantial to growing your client base.
You need to be cautious with this metric since the way it is calculated is rather confusing. To make sure you get it right, check out our guide to Facebook reach.
What is engagement on social media?
Engagement signifies how social media users interact with your accounts and content. Likes, comments, shares, and tags all count as engagements. The most reliable way to monitor it is by tracking your engagement rate.
The engagement rate gives you an understanding of whether your audience finds your content interesting and, well, engaging. Knowing this will help you make the right adjustments to your content planning and production.
What is follower growth rate?
The follower growth rate tells you how fast your follower base is growing. This metric may have a positive or negative value, depending on your new follows vs. unfollows rates.
Simply speaking – measuring it gives you a clear idea of whether your follower base is growing or shrinking, which in turn indicates if you are reaching the right audiences with the right content – you can read more about it here.
When analyzing these metrics, make sure to apply your measurements to your profiles as well as individual posts. Check which posts performed better than others and try to extract ‘post success factors’. Insights from such an exercise will help you create more informed content strategies moving forward.
Now it’s time to learn how to easily generate social media analytics reports!
Facebook’s native analytics tool
Facebook Analytics is no longer available as of June 30, 2021.1 However, Facebook Insights still work.
Facebook offers a free analytics feature to all Page owners, it’s called Facebook Insights. To access it, simply go to your Page level and select the ‘Insights’ feature from the menu on the left side of your screen.
Once you do so, you’ll see a number of analytics dashboards that reflect most of your basic metrics. Among others, you can check your reach, your post metrics, or ads’ performance.
If you need a very detailed set of information, you can export Facebook Insights data into an Excel file. Although, extracting specific sets of information may prove to be a bit tricky if you’re not an Excel expert.
And it’s definitely not the most appealing way to display the data in front of your stakeholders, especially when the analyzed time period is limited to only 7 days.
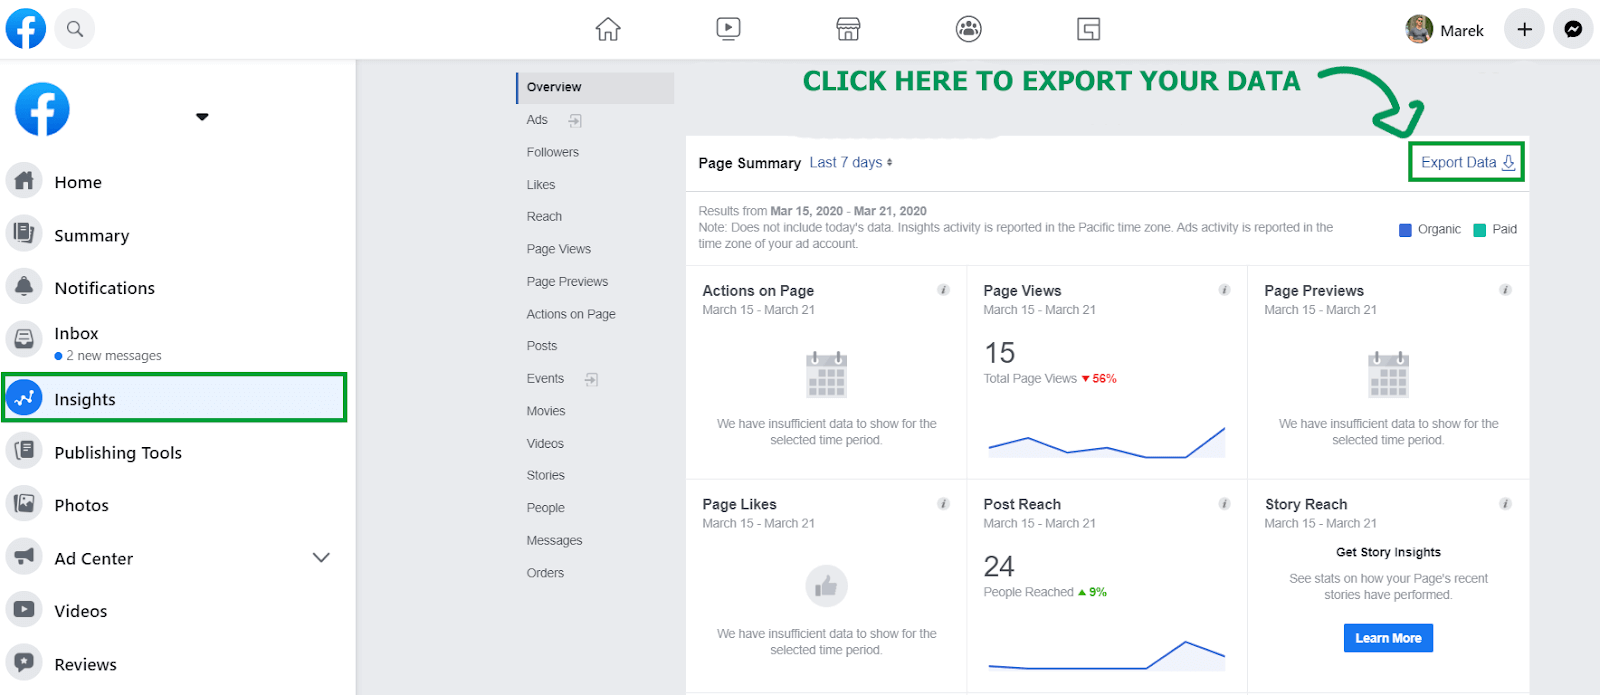
Facebook social media report – you can export your Facebook Page analytics into an Excel file
How to create in-depth Facebook and Instagram analytics reports in 2 minutes
Here at NapoleonCat, we strive to make the reporting process as easy and intuitive as possible.
Facebook and Instagram Analytics Reports
Analyze your own profiles & your competitors. Generate in-depth reports for Facebook, Instagram, and LinkedIn – with an all-in-one social media tool.
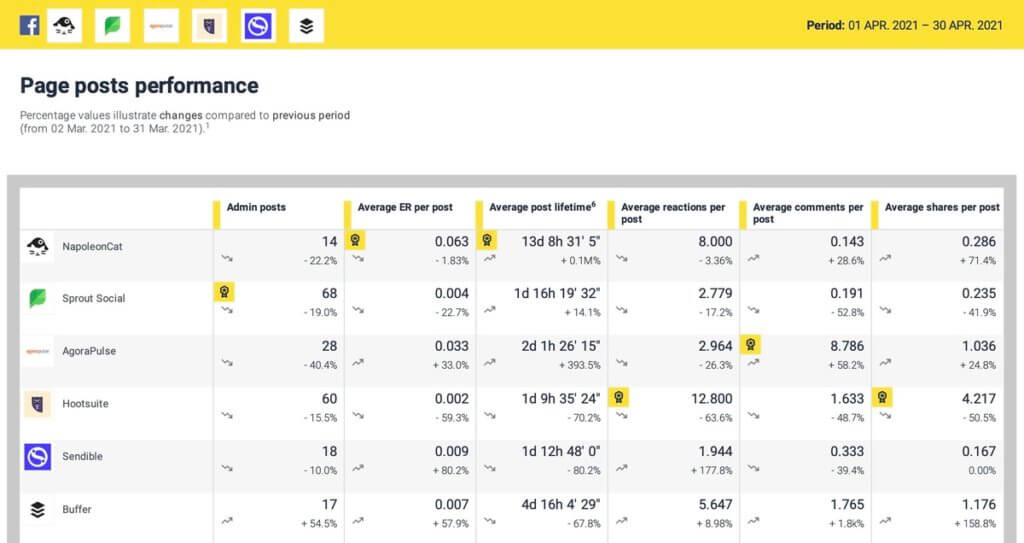
Our social media reporting tool allows you to create detailed reports for Facebook, Instagram, and LinkedIn profiles in a matter of minutes – and then automate report delivery to your team or stakeholders (you can schedule your reports so that they’ll be both generated and sent out automatically).
You can also generate competitive reports and track your competitors on social media. For Facebook, you can create a comparative report for up to 8 Pages at once.
By the way – if you’re just starting out with NapoleonCat, remember that it takes around 24 hours for the tool to fetch all the required data. After that time, you can enjoy the Reports & Analytics modules in their full effect.
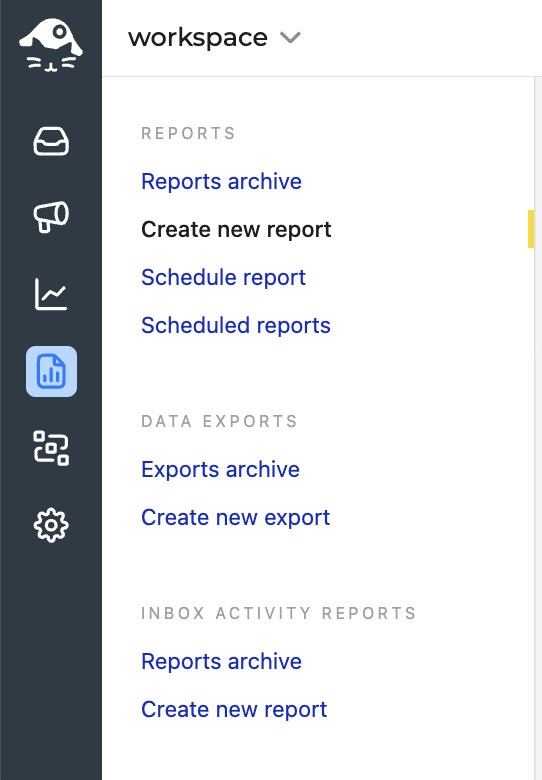
To create a social media report, simply click the reporting icon on the left side of your screen and select ‘Create new report’ from the menu.
This will take you to the report setup tab. First, you’ll be asked to choose the time range for your analytics report. Depending on your current needs, you can easily set a custom date range.
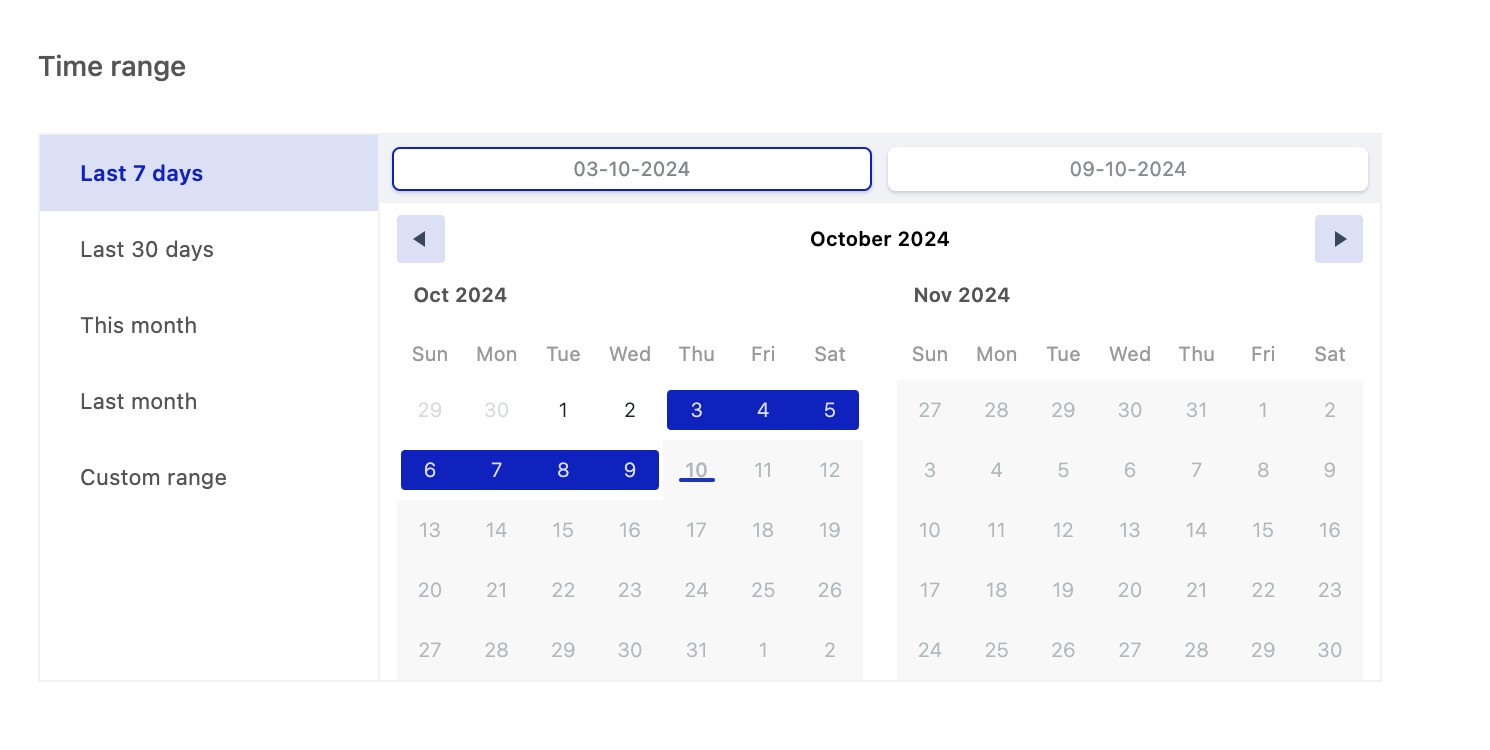
Facebook and Instagram report – choosing a time frame for your social media analytics report
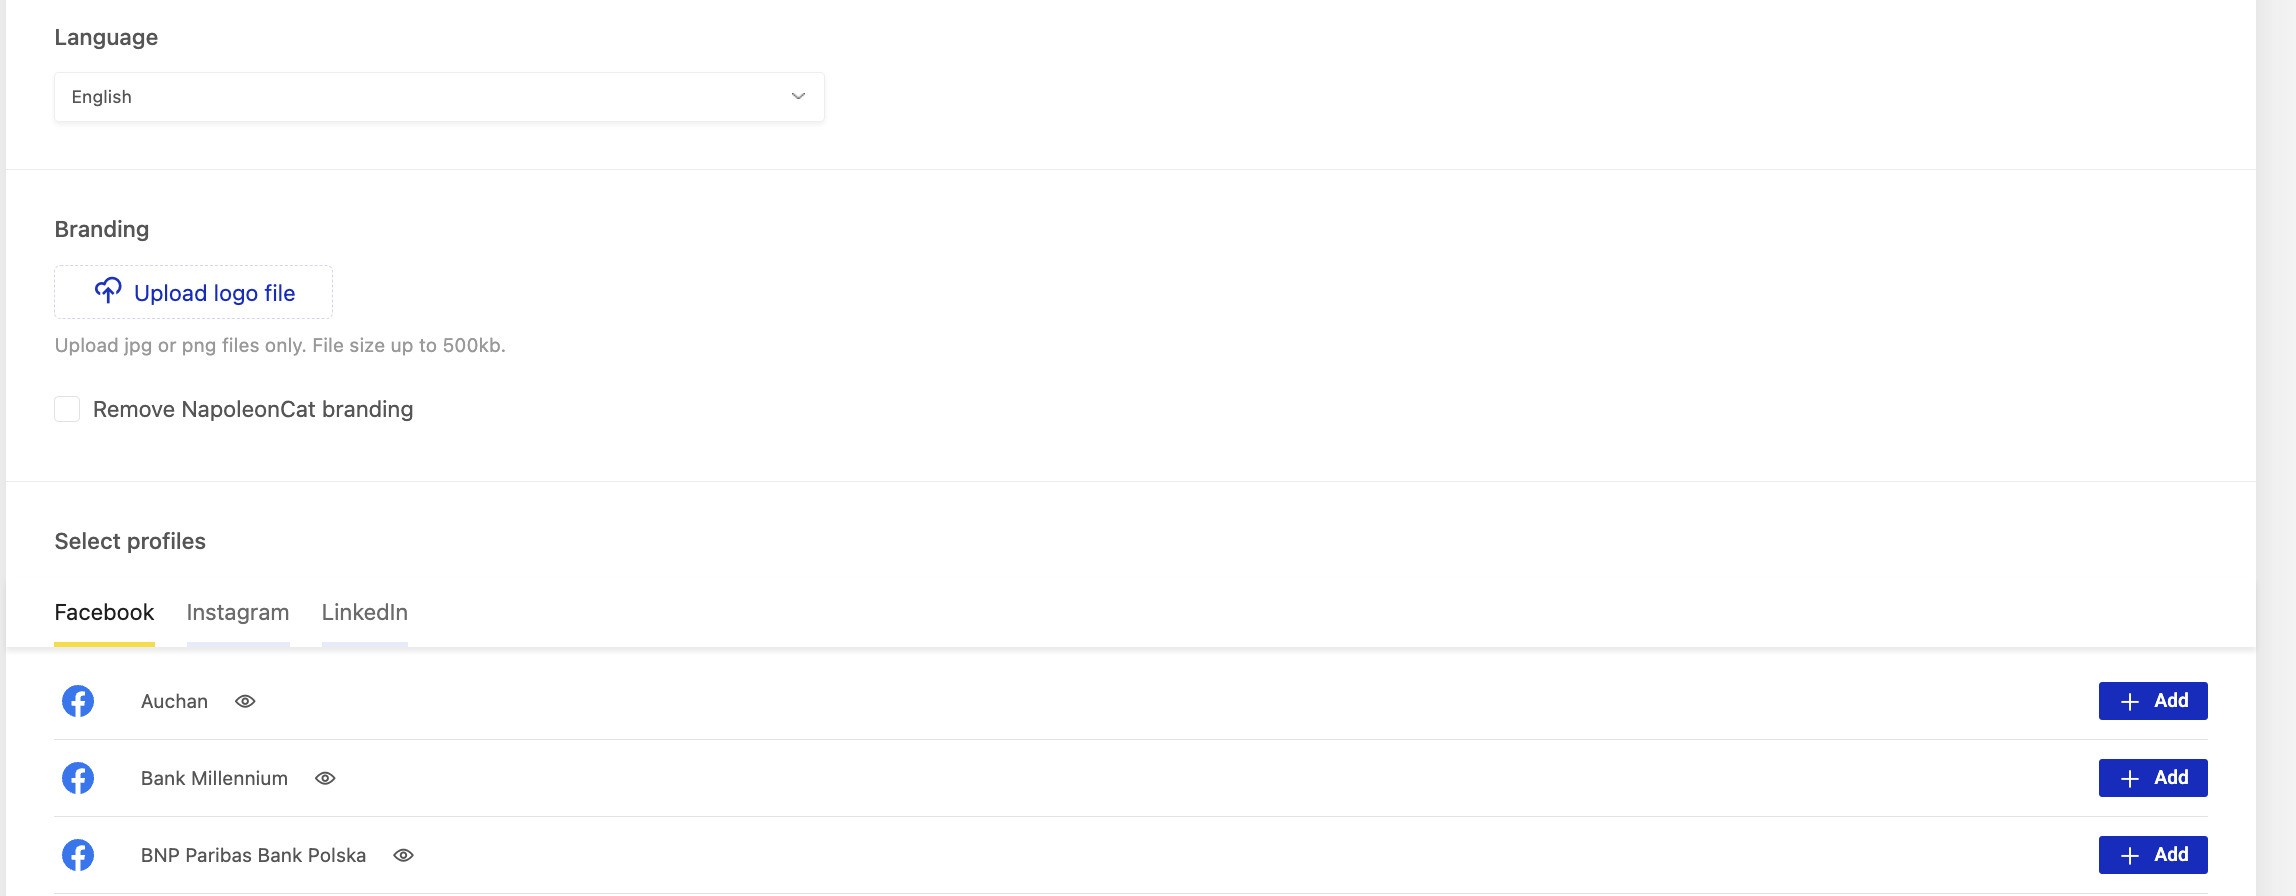
The next step is optional but definitely worth a try to make your report more visually appealing – adding your company’s logo.
If you wish to use the white label reporting option, you can personalize the social media report by removing NapoleonCat branding and uploading your company’s or client’s logo.
The logo will then be visible on each page of your social media report.
Now you can choose the profile to be featured in the report. To add a Facebook or Instagram profile, simply switch between the available tabs and click the corresponding ‘Add’ button on the right side of the screen.
When you click the button, a new window will pop up. This is the most important part of the process. Here you can choose from a wide range of social media metrics to be shown in the report.
By default, all metrics are selected. However, if you only need to quickly look up basic results, you can just choose the ‘Key metrics’ alone, but there’s so much more to see!
Try to think about the metrics that best reflect your business profile and KPIs and check the corresponding boxes. Now just click the ‘Generate’ button in the right lower corner and watch the magic happen!
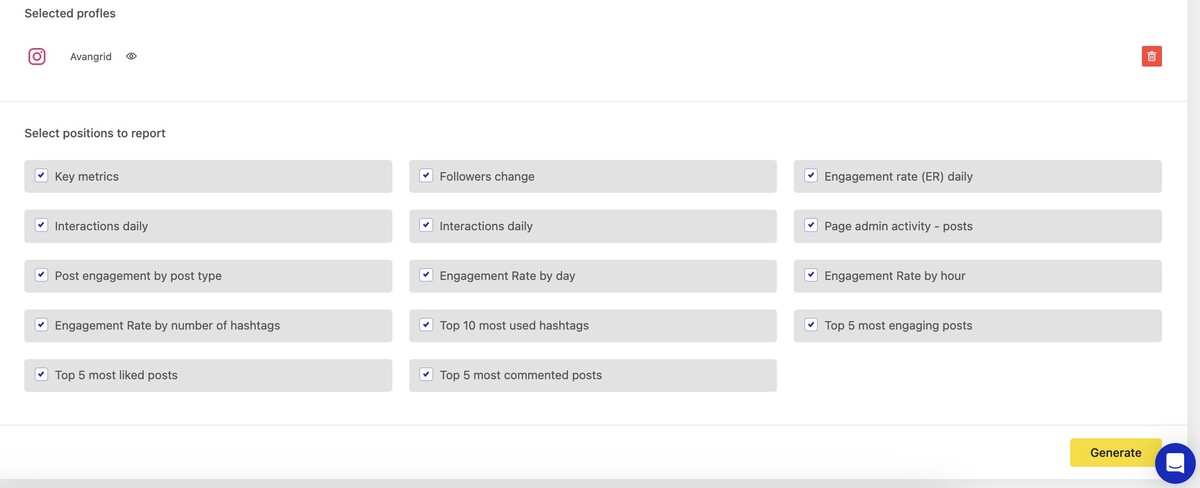
This is how the report creation process looks in real time – it usually takes less than a minute:
Creating a Facebook social media report in NapoleonCat – full process
Using NapoleonCat, you can schedule your Facebook and Instagram analytics reports to be automatically generated (weekly, monthly, or even quarterly).
You can also set up automatic delivery to team members, supervisors, clients, or stakeholders so that everyone is always on the same page about your progress.
If you need to, you can export data by downloading your report (in a friendly pdf. file format), just like you would in Facebook Insights, but for a larger scope of data.
Now you can open the pdf. file and start feeding your eyes with all the metrics displayed in one easy-to-follow report! The sample reports can be seen at the end of the video below:
Remember that you can create Facebook and Instagram analytics reports for any other public social media accounts. This way you can analyze your competitors, better understand your target audience, and improve your social media strategy!
Automate Facebook and Instagram analytics reports
Showcase your results with comprehensive social media reports. Automate report delivery to keep your team, clients, and stakeholders in the loop. Make data-informed adjustments to your strategy – with an all-in-one social media tool.
We highly recommend you test NapoleonCat completely for free – no credit card required 😉
Wrap Up
Collecting data is important, but analyzing it and being able to draw conclusions matters even more. A good social media reporting tool is definitely a must-have for everyone who works with social media.
Seeing all of your performance information in one comprehensive report can save you a lot of time and effort spent on analysis, especially if you run multiple Facebook or Instagram accounts. Remember: work doesn’t need to be hard if you find a smart way to do it. Good luck with your future results!
Facebook and Instagram Analytics Reports – FAQs
Below we answer the most common questions about creating Facebook and Instagram reports.
What are Facebook and Instagram analytics reports in NapoleonCat?
Facebook and Instagram analytics reports are ready-to-use documents (usually PDF or XLS) that compile key social media metrics such as reach, engagement, and follower growth. They help you assess performance and clearly present results to your team or stakeholders.
Why should I create analytics reports for Facebook and Instagram?
Analytics reports allow you to evaluate the effectiveness of your social media strategy, track progress over time, and turn raw data into clear insights. They also make it easier to communicate results to clients, managers, or internal teams.
Can I include competitor data in Facebook and Instagram reports?
Yes. Reports can include data from competitor profiles, allowing you to compare your performance against other brands in your industry and better understand your market position.
How do I create a Facebook or Instagram analytics report?
To create a report, go to the Reports section in NapoleonCat, choose the profiles and time range you want to analyze, select the metrics you want to include, and generate the report. The final file can be downloaded and shared.
Can I schedule Facebook and Instagram reports automatically?
Yes. You can schedule reports to be generated automatically on a weekly, monthly, or quarterly basis. Scheduled reports can also be sent automatically to selected email addresses.
What metrics can be included in Facebook and Instagram reports?
Reports can include metrics such as reach, impressions, engagement, follower growth, activity over time, and top-performing posts. The exact scope can be adjusted depending on the goal of the report.
How long does it take to generate a report?
Once profiles are connected and data is available, generating a report takes only a few moments. After initial setup, the process is fast and fully automated.
Are Facebook and Instagram reports suitable for client or management presentations?
Yes. Reports are designed to be easy to share, print, and discuss during meetings, making them suitable for client reporting, internal summaries, and performance reviews.
Check out our other articles about social media reporting & analytics:
- How to Create an Instagram Analytics Report
- How to Create a LinkedIn Analytics Report in 1 Minute
- How to Create a Facebook Analytics Report (in under 1 minute)
- How to Create a Social Media Report Without Breaking a Sweat
- Social Media Report Automation for Agencies – Full Guide
- 17 Free and Paid Social Media Analytics Tools for Teams
- The Easiest Way to Create a Weekly Social Media Report
- How to Create a Monthly Social Media Report (in under 1 minute)

