Table of Contents
- Why analyze your Instagram performance in the first place
- How to create a custom Instagram analytics report with NapoleonCat’s reporting tool
- Schedule a recurring Instagram analytics report (it’s even quicker)
- Create Instagram analytics reports for your competitors’ accounts
- And in case you were wondering…
- Your turn
Let’s face it: reports are rarely anyone’s favorite tasks (if they’re yours, I commend you, really.) But someone’s gotta do them. Here’s how to create an Instagram analytics report so it’s actually helpful for anyone reading it – and takes little to no time.
- Why analyze your Instagram performance in the first place
- How to create a custom Instagram analytics report with NapoleonCat’s reporting tool
- Schedule a recurring Instagram analytics report (it’s even quicker)
- Create Instagram analytics reports for your competitors’ accounts
- And in case you were wondering…
- Your turn

Create Instagram analytics reports within seconds
Generate custom Instagram reports within seconds. Schedule automatic reports, analyze your competitors, and more – with an all-in-one social media tool.
Why analyze your Instagram performance in the first place
(Other than because your boss or client keeps asking for that report.)
Well, analyzing and reporting on your Instagram marketing (and generally, any social media activity, or in fact, any marketing activity) is for you to:
- Know what works and what doesn’t
- Stop doing what doesn’t work and do more of what does.
Ultimately making your Instagram marketing much more effective, engaging, and profitable. And reporting on those analytics in regular intervals helps you keep track of things and see the progress you’re (hopefully) making.
Plus, of course, it’s essential when you work for an agency to show your clients how well they’re spending their money with you. And it also helps justify spending money on ads, influencer partnerships, recording those reels, etc. Anyone who’s ever asked their boss for a bigger campaign budget knows this.
The thing with reports is, though, they take time and are not a very exciting activity (like anything involving Excel spreadsheets.)
Well, the good news is that there are analytics tools available with easier, automated ways to create Instagram reports that focus on all the important data while looking great and requiring minimum effort from you.
Shall we take a look at one of them?
How to create a custom Instagram analytics report with NapoleonCat’s reporting tool
It’s really easy, and takes about a minute – below are the steps to follow to create an Instagram analytics report.
First, you can test NapoleonCat completely for free for 14 days and connect your Instagram accounts for analytics – no credit card required during signup 😉
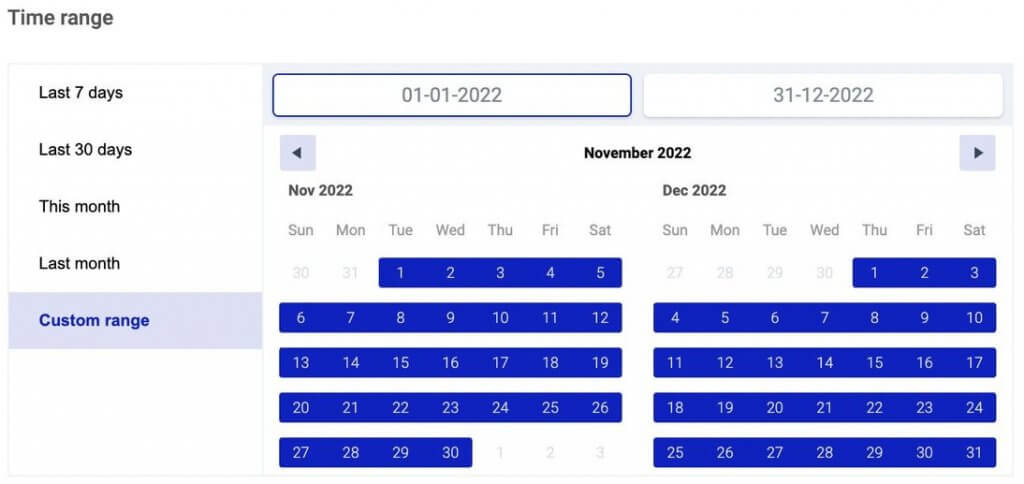
- Go to Reports in your NapoleonCat dashboard. Click “Create new report”, and select the time frame. You can select a completely custom time period for your Instagram analytics report.
(By the way, you can also create similar reports for Facebook and LinkedIn.)
- NapoleonCat lets you brand your Instagram report, so it looks even nicer and more pro. To do that, add your company’s or your client’s logo. You can also remove NapoleonCat branding if you don’t want to include it.
- Select the Instagram profile you want to report on.
- Review and select the metrics to track in your Instagram report. These include your audience demographics and your post performance metrics:
- Key metrics
- Followers change
- Followers by age and gender
- Followers by country
- Followers by city
- Daily engagement rate
- Daily interactions
- Reach
- Impressions
- Daily profile views
- CTA clicks
- Page admin activity
- Post engagement by post type
- Engagement rate by day
- Engagement rate by hour
- Engagement rate by number of hashtags
- Most used hashtags
- Most engaging posts
- Most liked posts
- Most commented posts
- Most viewed Instagram Stories
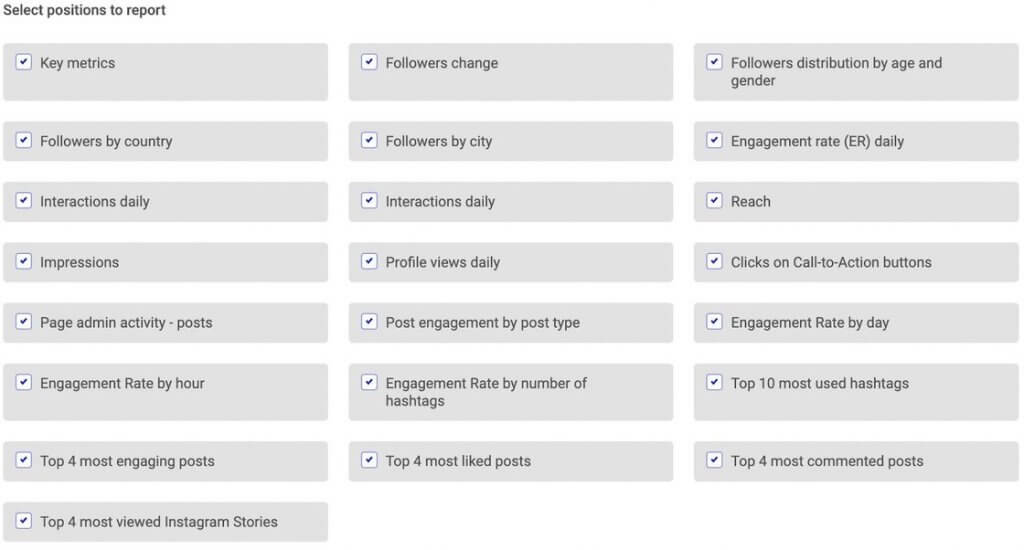
Depending on what you or your client needs, you can include all of the metrics or just the ones that are key in your case. For example, if you’re only reporting on audience growth, you can leave just the metrics relevant to your audience.
5. Click “Generate” and wait for the report to appear in your account. The report will be created automatically, but it can take a minute or two – all depending on the volume of the data the system needs to go through (so, the fewer accounts and metrics, the quicker the report generation.)
6. Then you can do a few more things:
- Download the report as a PDF file and save it on your computer. Then send it to whoever needs to see it. You’ll also get an email with a link, so you can share that with others.
- Schedule your Instagram report to email it directly to selected recipients – this way you don’t have to do it manually.
- Create another similar report.
- Edit or delete the report.
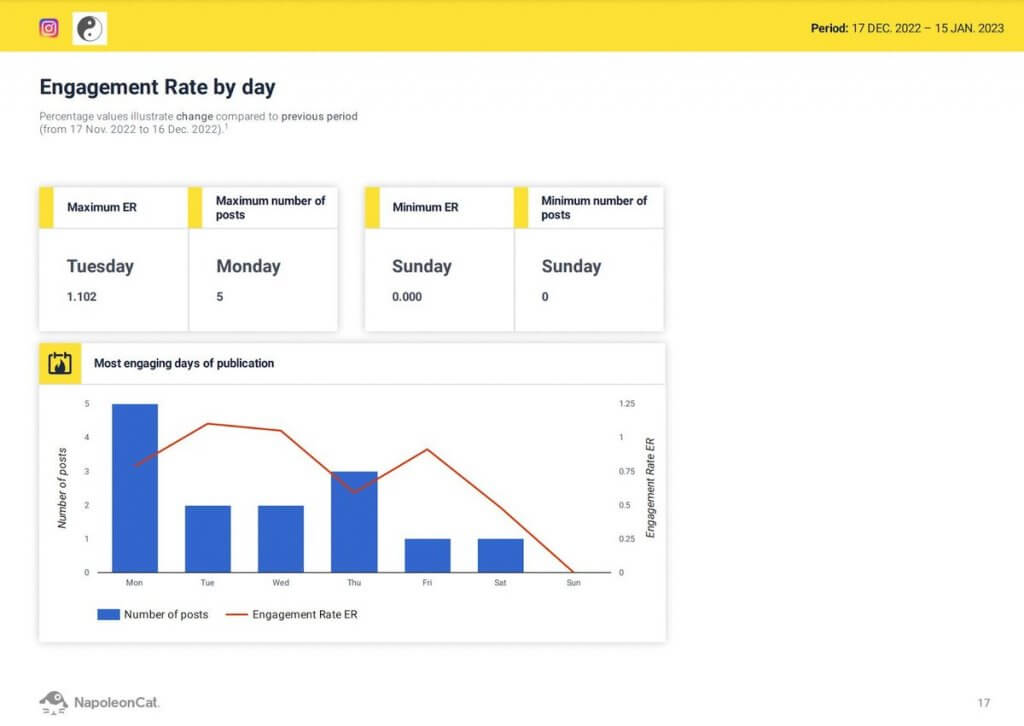
Here’s what a sample page from an Instagram analytics report created in NapoleonCat looks like:
And here’s a step-by-step video guide that’ll take you through the entire process of creating an Instagram report:
Schedule a recurring Instagram analytics report (it’s even quicker)
If you have to report on your Instagram analytics on a regular basis, you can avoid creating the report every time you need to send it by scheduling it automatically. Here’s how to do that:
- Click ”Schedule Report”.
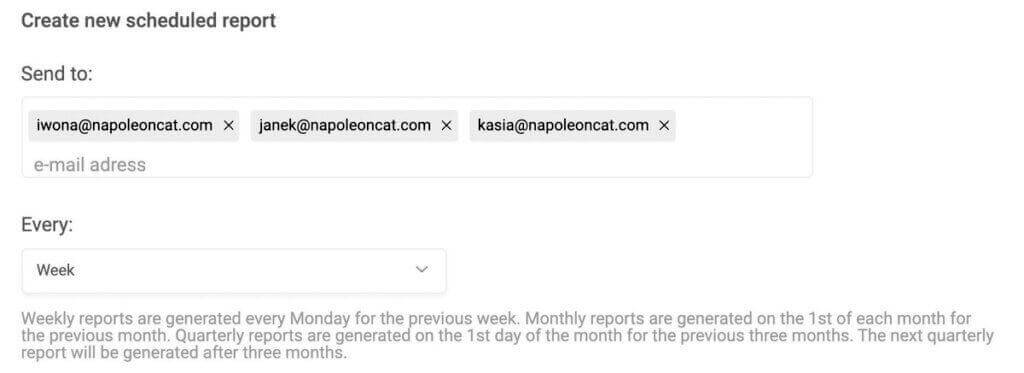
- Paste the emails of the people who need to receive the report. This could be your manager, CMO, CEO, your client, etc.
- Define the time intervals to send the report in. You can choose to send your reports weekly, monthly, or each quarter.
- Then follow the steps from the initial process – select the accounts and the metrics for your report.
- All your scheduled reports will be available in the “Scheduled reports” tab.
This way, you can schedule your Instagram analytics report once and wait for the email to arrive every week, month, or quarter, without having to do anything at all. (You can, though, review the report before it gets sent, for example, to add a new, relevant Instagram metric.)

Automate Instagram Analytics Reports
Schedule weekly, monthly, or quarterly Instagram reports. Automate report delivery to your clients – with an all-in-one social media tool.
Create Instagram analytics reports for your competitors’ accounts
Want to compare your performance to the benchmarks in your industry?
With NapoleonCat, you can create Instagram reports for other Instagram accounts (and also Facebook Pages and LinkedIn Company Pages).
This will help you compare and benchmark and can provide some helpful input for your marketing strategy.
You can create a report for any Instagram business account and compare things like profile views, post reach, post performance, engagement rate, or follower growth. Here’s what that might look like:
And in case you were wondering…
How to make an Instagram report for your company
First of all, define your essential KPIs (key performance indicators) – especially the ones that really matter for your business and help you achieve goals, e.g. building brand awareness, or selling your products and services.
Then match them to your Instagram analytics report metrics.
Of course, your CEO will probably also enjoy seeing some vanity metrics like post reach or likes, but try focusing on the ones that matter for the bottom line:
- What kind of Instagram content brings in new and repeat customers?
- What types of content help generate traffic to your website?
- What content do your followers engage with?
In other words, keep your Instagram performance report consistent with your Instagram content strategy, entire social media marketing strategy and overall digital marketing goals. That way you can show your decision-makers how Instagram works for the business and also where the Instagram marketing dollars go (or why you should spend more.)
How to get an Instagram report to a client
It works essentially the same way. The things you need to consider here are:
- What are your client’s goals as far as Instagram marketing goes?
- What are you helping them with, and what results do they expect from you?
- How proficient are they in reading and interpreting Instagram analytics or a social media report? (Sending them something they won’t really get will probably hardly impress them. Though you never know, do you?)
Again, highlight the metrics relevant to your client’s business. You can also include the ones that look particularly impressive over a given time period (for example, an impressive audience growth following a marketing campaign.) Just don’t forget about what those numbers actually mean for the business – especially if you want to build trust (which you should.)
You can also include all the available metrics in NapoleonCat and walk your client through them on a weekly status call or attach a Loom video for context and some explanation.
To enhance your agency’s brand image, don’t forget to brand your report with your agency’s or your client’s logo.
Easily create Instagram analytics reports
Create (or schedule) multiple Instagram reports within minutes. Generate reports for your own profiles and your competitors’ – with an all-in-one social media tool.
Your turn
As you can see, creating an Instagram analytics report is really easy with NapoleonCat, and you don’t really have to do much (except maybe make a few more strategic decisions beforehand.)
It’s a great way to save the time you would otherwise spend getting the statistics, placing them in an Excel spreadsheet, adding formulas, and then sending it all to your client or boss every time. Automate it with NapoleonCat, and spend that time doing something that helps improve your performance (or your client’s performance) based on what the analytics tell you.
Check out our other articles about social media reporting & analytics:
- Top 10 Social Media Analytics Tools for Teams
- The Easiest Way to Create a Weekly Social Media Report
- How to Create a Monthly Social Media Report (in under 1 minute)
- How to Create a Facebook Analytics Report (in under 1 minute)
- Creating Facebook and Instagram Analytics Reports: A Guide
- Your Guide to LinkedIn Analytics Reports

