Save hours on social, every day.
Automate moderation and replies, schedule posts, and pull reports - all in one tool.
Want to build your brand presence and connect with your target audience? You can do no wrong by using Twitter for business. Twitter is an engagement goldmine, after all.
But when it comes to drumming up the type of engagement that drives business success, following “best practices” can only take you so far.
How sure are you that your tweets are resonating with your audience? To find out, you need to track and measure your social media performance.
Using the free Twitter analytics tool helps – but only up to a point. If you want to generate insights that help you truly understand your audience and publish tweets that generate sales, use a dedicated Twitter report tool.

Your Ultimate Twitter Report Tool
Analyze your own profiles & your competitors. Generate in-depth reports for Facebook, Instagram, and Twitter. Try it for free:
Try NapoleonCat free for 14 days. No credit card required.
Why tracking Twitter performance is essential
So, why do you need to consistently keep track of how your company’s tweets are performing? Let’s go over the top reasons one by one.
1. To see what works and what doesn’t
Tracking your company’s Twitter performance metrics (likes, comments, retweets, etc.) helps you identify which tweets are having an impact on your audience (and which ones are not).
It helps you gain insights on:
- The best times to post
- The right tweet frequency
- The best types of tweets (images, GIFs, quotes, videos, Twitter threads, etc.)
In other words, measuring your tweets helps you see what works and what doesn’t, giving you the insights you need to refine your content strategy and optimize your Twitter campaigns. It also allows you to get a better understanding of your target audience, and in turn, helps you optimize your content for better results.
2. See where leads or customers are coming from
By generating engagement on the platform, you can take your audience on a customer journey and convert them into paying customers.
Once a follower buys your product or service, you can track the tweets they’ve engaged with and be able to see which types of engagement are more likely to translate to a conversion or a sale.
This is important because you don’t want to engage your audience in ways that don’t nudge them along your customer journey. Because, sure, you want to nurture your relationship with your audience, but you want to do it in a way that generates enough return on your investment.
3. Helps you stay the course
Tracking your Twitter analytics allows you to take a step back and see if your main goals are being met.
It can be too easy to get hung up on likes and retweets, but those types of engagements won’t be useful to your goals if you don’t see them in the right context.
By setting a goal and tracking the performance of your tweets, you can identify clear benchmarks to help you measure your progress and identify specific steps to reach your goals.

Before tracking anything, set a goal first
Before measuring anything, you need to define a specific goal for your Twitter marketing campaign. After all, if you’re publishing tweets without a specific goal in mind, how would you know if you’re making some real progress? How do you know which metrics to track and measure?
Besides, according to a Coschedule study, marketers who set specific goals are 376% more likely to achieve marketing success than those who don’t.
Some goals you can target in your Twitter marketing campaign include:
- Generating more leads
- Increasing sales
- Driving traffic to your website
- Creating a buzz around a product or service
- Building a community
- Etc.
How do you set the right goal? Using the SMART goals framework can help.
- Specific: Is the goal clear and defined?
- Measurable: Can it be assessed with social media metrics?
- Achievable: Can you achieve the goal within the scope of your resources?
- Relevant: Does it contribute to your brand mission?
- Time-bound: Can it be completed within a finite time frame?
When choosing a specific goal, it helps to figure out where you currently stand in respect to your brand mission. Determine your positioning in the market and see how you can use your resources to help advance that mission.
Twitter Report Tool
Create Twitter reports for your own accounts + competitors, too. Find out what content performs best, when it’s best to tweet, and more. Generate automated Twitter reports. Try NapoleonCat for free:
Try NapoleonCat free for 14 days. No credit card required.
Measuring Your Twitter impact with the basic Twitter Analytics Tool
You can measure your social impact on Twitter for free (so you don’t have an excuse not to do it) using the basic Twitter analytics tool.
With the free Twitter analytics tool, you can:
- Track how people engage with your tweets in real-time.
- Get a detailed view of each tweet’s number of retweets, replies, likes, follows, etc.
- Get helpful insights about your audience based on how they engage with your tweets.
- Download key Twitter metrics.
To access your Tweet Activity Dashboard, visit analytics.twitter.com and click on Tweets.
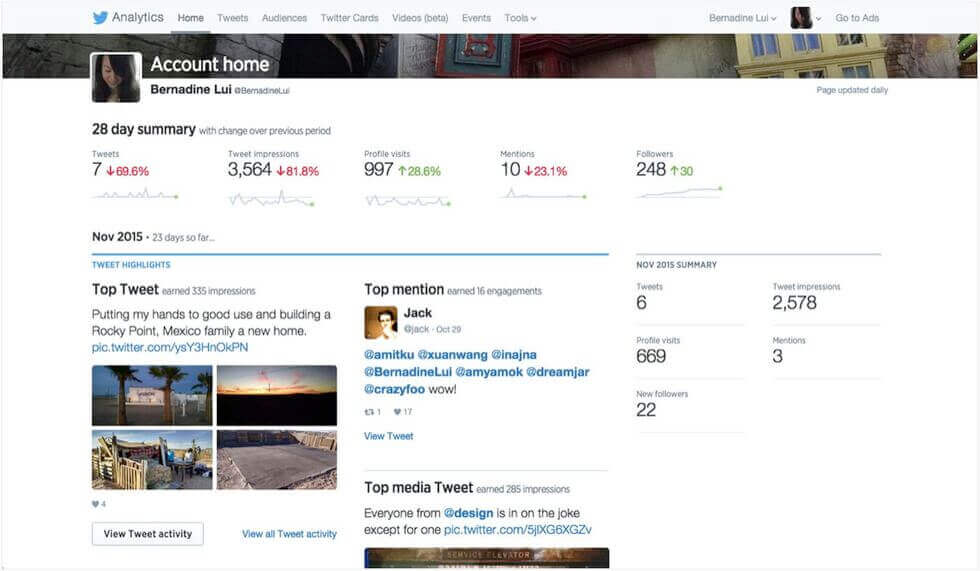
In addition to letting you know how many times people have seen, Retweeted, replied to, and liked each Tweet, the Tweet Activity Dashboard also lets you select the data range (last 7 days or last 28 days) and export the data as a CSV file.
How to create a Twitter report in 2 minutes using a dedicated Twitter report tool
You might be wondering if you should use a dedicated Twitter report tool when you can use the basic Twitter analytics tool for free.
It all comes down to your priorities:
- Is Twitter analytics core to identifying opportunities for your business?
- Do you need to analyze your competitors on Twitter?
- Do you need advanced, reliable stats to help you connect the dots on the customer journey (and in, turn, improve the customer experience)?
- Do you need more historical data?
- Do you feel like you’re outgrowing Twitter’s free analytics tool?
- Do you want to send Twitter analytics reports that will impress your clients (or bosses)?
If you want to invest in features and capabilities that drive value, then you’re better off upgrading to a dedicated social media analytics tool like NapoleonCat.
As a Twitter management tool for business, NapoleonCat helps you determine how people talk about your brand on the social media platform and contribute to the conversation.
It’s a social media reporting tool as well. NapoleonCat helps you generate detailed reports for Twitter, Instagram, or Facebook accounts within minutes. You can also schedule your reports and automatically send them to your team or stakeholders
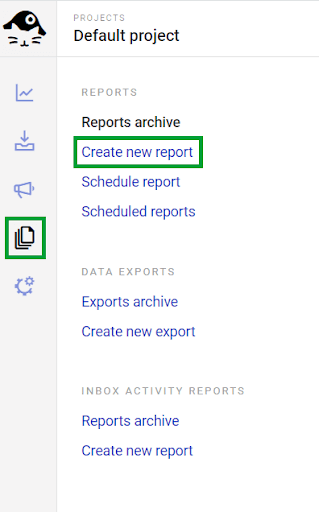
To create a Twitter report on NapoleonCat, click the reporting icon on the left side of your screen. Then select ‘Create new report’.
Next, you’ll be asked to ‘Create new report.’ Choose a time range for your analytics report. You can choose a custom date range depending on your needs.
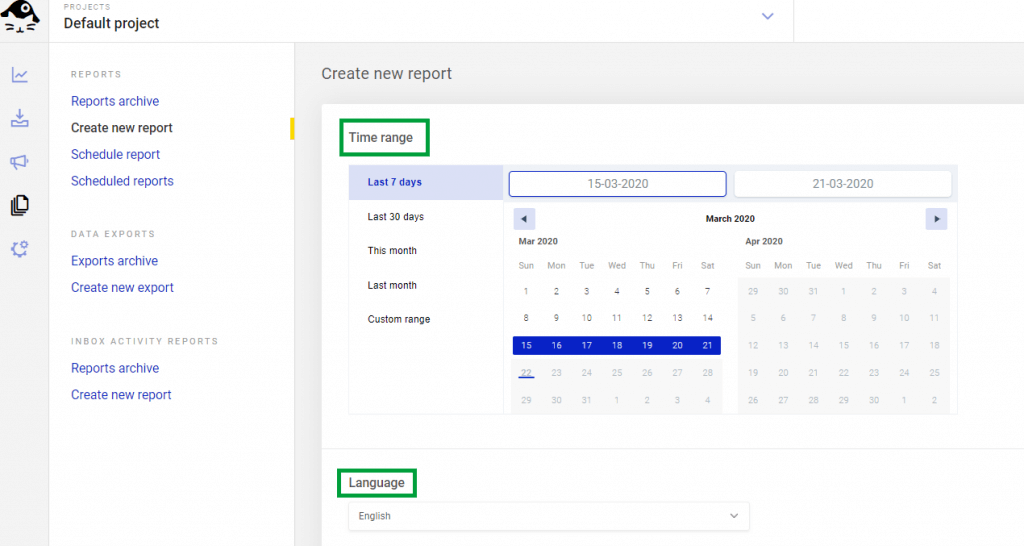
Want to personalize your Twitter analytics report? You can remove the NapoleonCat branding and upload your company’s logo by using the white label reporting option.
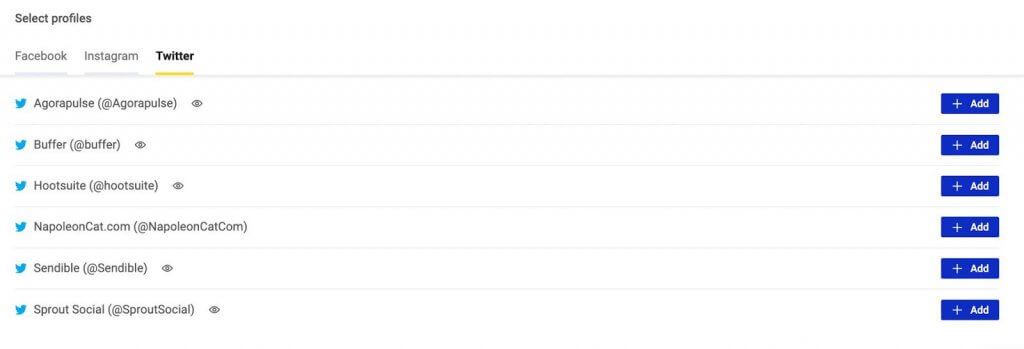
Next, choose the Twitter profile you want to feature in the report. To choose a Twitter profile, click the corresponding ‘Add’ button on the right side.
Lastly, you’ll be asked to select the metrics you want to show in the report. By default, all metrics are selected. Again, select your key metrics based on the goals you’ve set for your Twitter campaign.
Lastly, schedule your report (weekly, monthly, or quarterly) and have it sent automatically to your team and/or stakeholders.
You can export the data by downloading the report as a PDF file. That way, you can see all your Twitter performance metrics in one user-friendly (and context-friendly) report.
To see a sample Twitter report, check out this video:
Which Twitter performance metrics should you track?
Once you’ve chosen a specific goal for your Twitter marketing campaign, it’s time to pick the key Twitter metrics to track and measure.
Twitter performance metrics to track for each campaign goal:
For boosting online reach
Reach shows how many unique Twitter accounts have seen your post. To determine your reach, simply divide the number of impressions by total followers. What do you do with this information to improve your Twitter marketing campaign?
If a tweet receives a higher reach than usual, you can analyze what makes that tweet resonate with your audience and use the insights you gain to optimize future tweets and stories.
For increasing follower growth (or building a community)
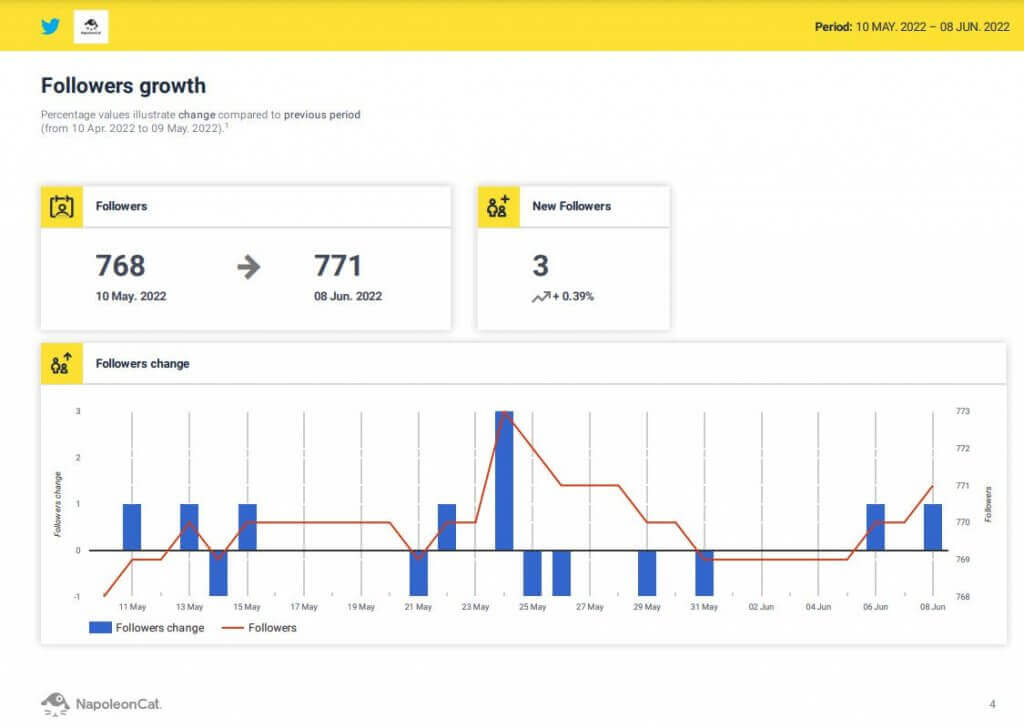
Your reach isn’t worth a darn if the people reading your tweets are not engaged enough to follow you. You want to keep track of how many followers you’re gaining over time so you can optimize your tweets for follower growth. After all, followers are more likely to become paying customers down the line.
Ideally, follower growth should be directly proportional to increases in engagement. If you see a spike in new followers, track your tweets using a social media analytics tool so you can identify a pattern as to which tweets are more likely to convince or motivate them to follow you on Twitter.
Using NapoleonCat, you see a graph showing how many followers you’re gaining each day.
For increasing the engagement rate
Keeping track of likes, replies, mentions, retweets, etc. is important when measuring your company’s social impact. Why? Because they are a sign that your tweets are resonating with your target audience.
What’s more, it’s through engagement that you can nurture your network of fans and followers on their way to becoming customers and brand advocates.
It bears noting that engagement is not an end in itself. You need to make sure that your tweets are generating the kinds of engagement that result in conversions.
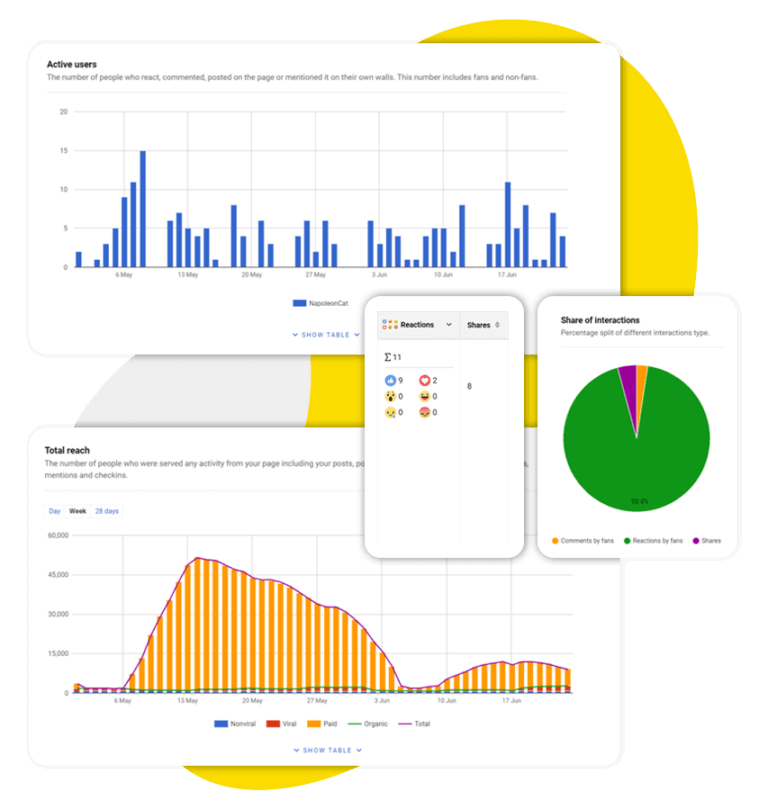
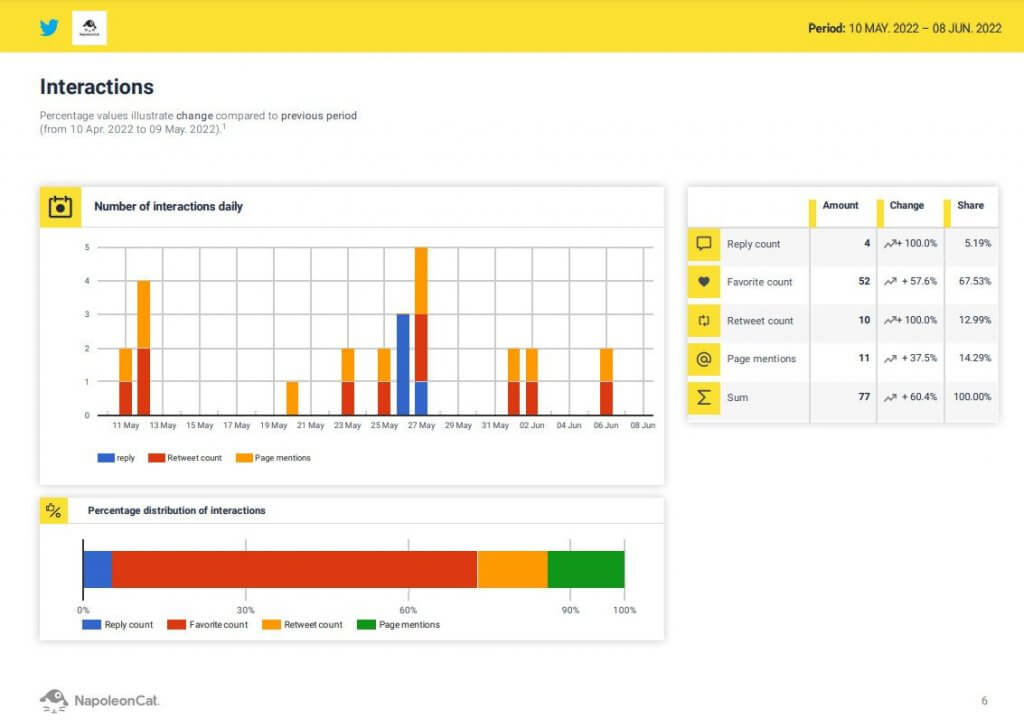
NapoleonCat’s Twitter reports helps you accomplish that by giving you a visual-friendly breakdown of the interactions within your account.
Using NapoleonCat, you can track the number of interactions via the following:
- Reply count
- Favorite count
- Retweet count
- Page mentions
- Sum of all interactions
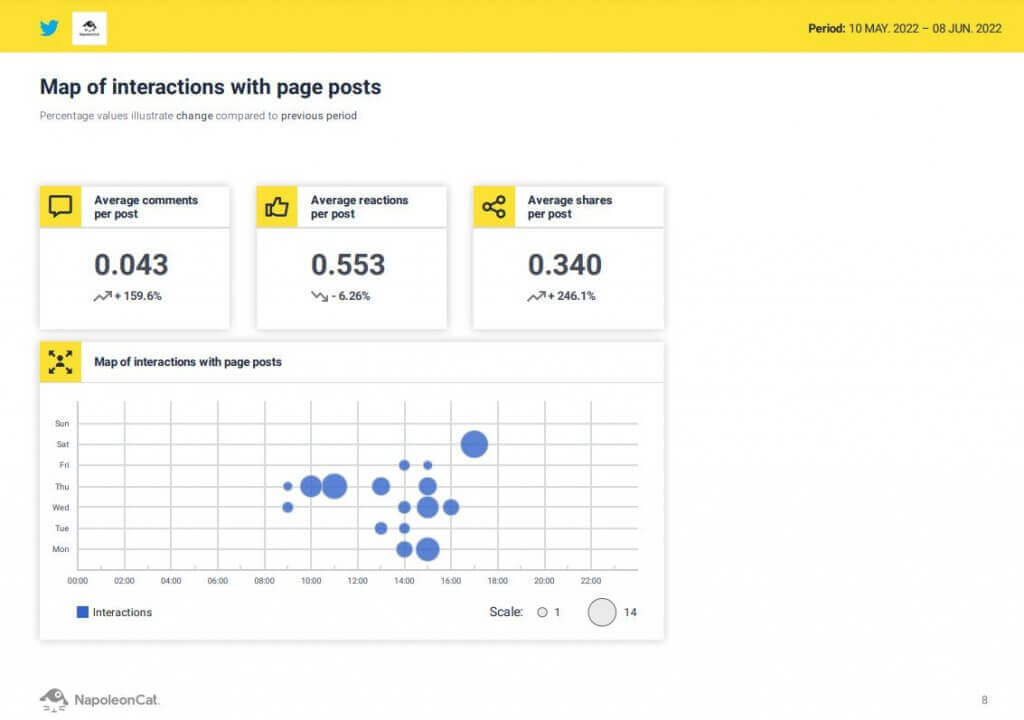
What’s more, the report gives you a map of interactions to help you determine how (and why) people are engaging with your content. This map illustrates the following metrics:
- Average comments per post
- Average reactions per post
- Average shares per post
You also want to review your top-performing tweets so you can get an idea of which types of content will have more impact on your audience.
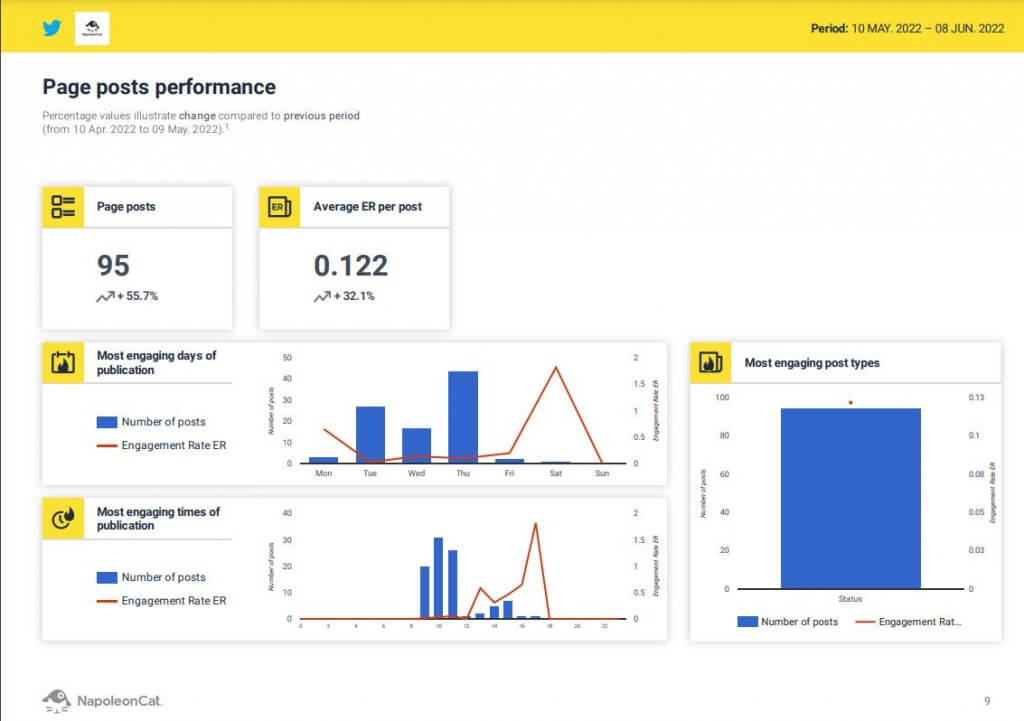
NapoleonCat’s reports have a ‘Page posts performance’ section that gives you a granular breakdown of which kinds of content your audience is engaging with the most.
It shows metrics like:
- Average ER per post
- Most engaging days of publication
- Most engaging times of publication
- Most engaging post types
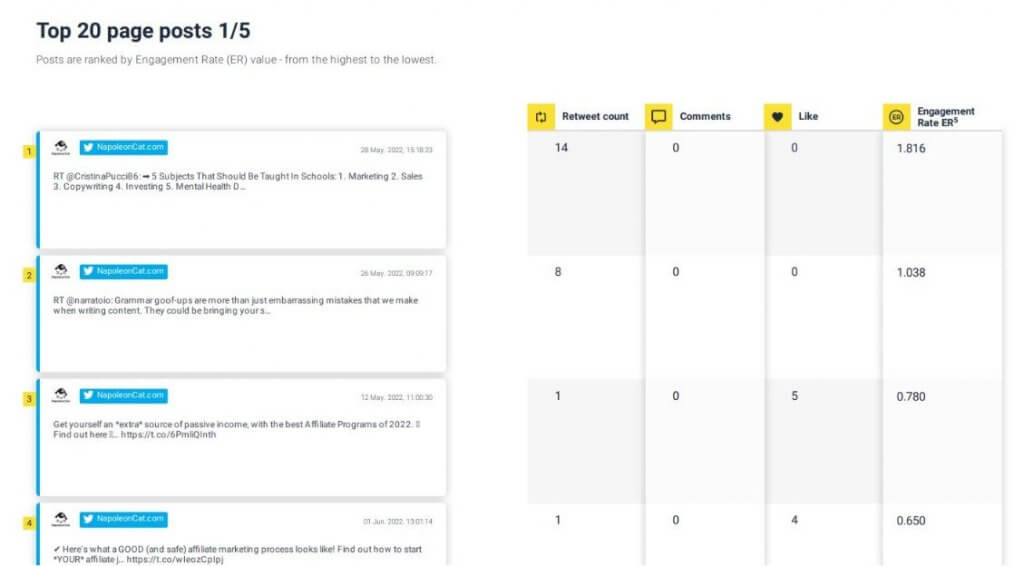
You also get a Top 20 page posts section to show how well specific tweets performed
For improving customer satisfaction
Measuring customer satisfaction is hard. But you can gather different data sets to get an approximate measure of how audience and followers view your tweets.
You can track the following Twitter performance metrics to assess customer satisfaction.
- Response time. The faster you respond to tweets, the better it will be for customer satisfaction.
- Loyalty. Keep track of how many followers you have gained (or lost) between each successive social media audit.
- Customer sentiment. Understanding how customers feel is key to improving CX and customer service. You can use Social Inbox to tag the sentiment of every conversation (positive, negative, neutral) on Twitter.
Once you’ve tagged enough conversations, you can use the collected data to observe customer sentiment trends and behavioral shifts among your customers and followers over time.
Tracking competitors on Twitter
A Twitter competitive analysis is important for generating insights that will help you differentiate your brand from your competitors and, in turn, create the kinds of content that will help you stand out from the crowd.
Analyzing your competitors on social media, however, can be labor-intensive and time-consuming.
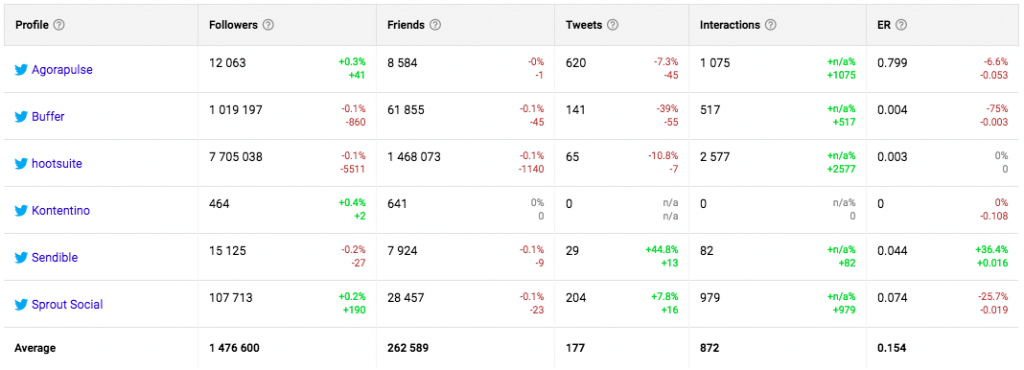
With NapoleonCat, not only can you generate reports for other public profiles in a few minutes, but you also get a lot of data to work with. This allows you to:
- Conduct Twitter competitor analysis for each profile individually.
- Generate real-time data for each profile and compare them side by side.
- Perform real-time benchmarking in seconds.
Twitter Report Tool
Create Twitter reports for your own accounts + competitors, too. Find out what content performs best, when it’s best to tweet, and more. Generate automated Twitter reports. Try NapoleonCat for free:
Try NapoleonCat free for 14 days. No credit card required.
Wrap up
I’m sure you’ve already heard the old chestnut: “Content is king.”
I disagree. I’ll do you one better: Context is king!
After all, if you want to create content that will have an impact on your Twitter audience, it helps to see what the data tells you. But don’t just look at any data. If you want data that drives real results, you can do better by using a dedicated Twitter report tool.