![Instagram Statistics for Marketers [2026 Update]](https://napoleoncat.com/wp-content/uploads/2020/02/instagram-statistics-that-matter-to-marketers-768x402.jpg)
Save hours on social, every day.
Automate moderation and replies, schedule posts, and pull reports - all in one tool.
Table of Contents
- Instagram user statistics
- Instagram usage statistics
- Instagram audience and demographics statistics
- Instagram advertising and marketing statistics
- Instagram Reels statistics
- Instagram Stories statistics
- Instagram Threads statistics
- Instagram for business statistics
- Instagram influencer statistics
- How to make Instagram work better for your business
- FAQs
- What generation uses Instagram the most?
- What is the breakdown of Instagram users by age?
- What is the breakdown of Instagram users by gender?
Instagram is still one of the biggest social media platforms out there, with tons of user engagement that businesses use to drive conversions and boost sales. Want to see some numbers? Sure you do; that’s what you came here for, right? 🙂
- Instagram user statistics
- Instagram usage statistics
- Instagram audience and demographics statistics
- Instagram advertising and marketing statistics
- Instagram Reels statistics
- Instagram Stories statistics
- Instagram Threads statistics
- Instagram for business statistics
- Instagram influencer statistics
- How to make Instagram work better for your business
- FAQs
- What generation uses Instagram the most?
- What is the breakdown of Instagram users by age?
- What is the breakdown of Instagram users by gender?

Simplify Instagram Business
Management with One Tool
- Manage & reply to comments and DMs in one place.
- Monitor ad comments from multiple accounts.
- Automate answers to repetitive questions.
- Schedule posts to multiple accounts, on desktop.
- Analyze performance and monitor hashtags.
- Keep track of your competition.
- Create or schedule in-depth reports in seconds.
Instagram user statistics
Instagram has 2 billion monthly active users, making it the third-largest social media platform, just after Facebook and YouTube, and sharing third place with WhatsApp.
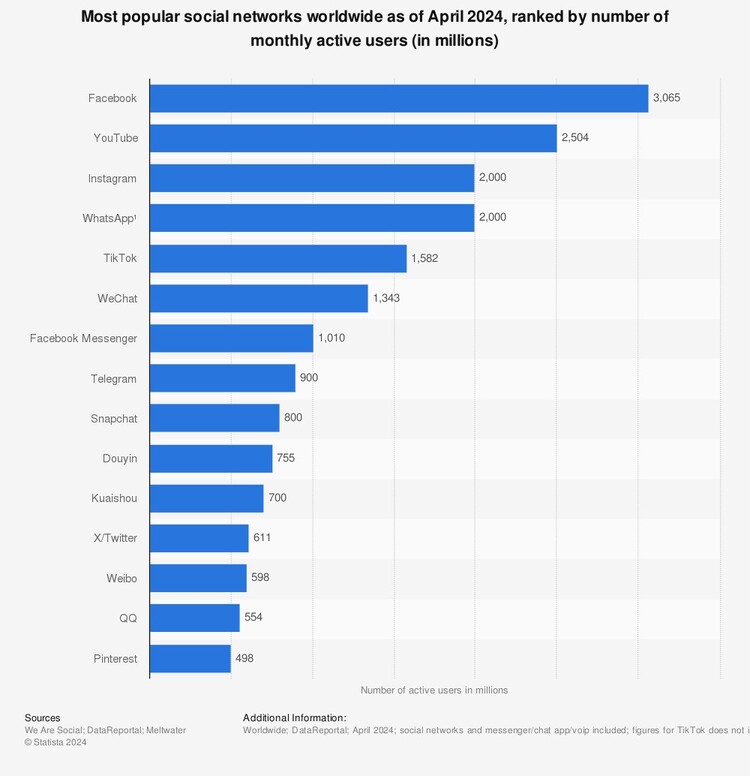
Facebook still has almost double the number of users, but Instagram’s audience keeps growing. In 2021, there were 1.21 billion monthly active users on Instagram, so that’s a growth of around 66%.
You’ll find more specific details on the audience demographics and location in the sections below.
Instagram usage statistics
- 37.04% of the world’s 5.4 billion active internet users access Instagram on a regular basis.
- 35.21% of the world’s 5.68 billion active mobile phone users access Instagram.
- Instagram is the world’s fourth top most visited website, according to SimilarWeb, even though it’s primarily a smartphone app. Unsurprisingly, the three websites before it are Google, YouTube, and Facebook.
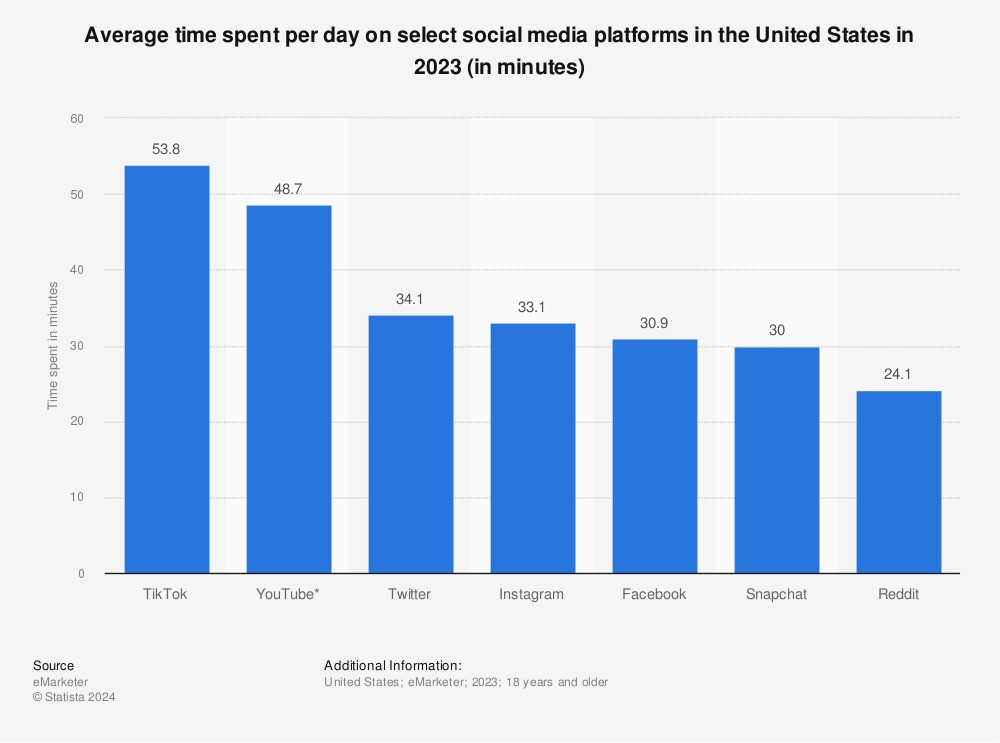
- In the US, an average Instagram user spends 33.1 minutes per day on Instagram. This is considerably less than TikTok, which has similarly short content forms, and (unsurprisingly) YouTube, which is famous for much longer-form content.
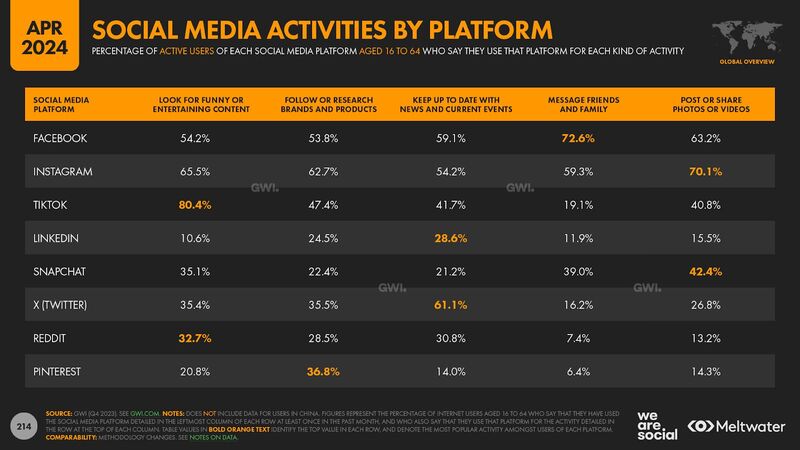
- Reasons for using Instagram, according to Data Reportal, include posting or sharing photos and videos (70.1%), looking for funny or entertaining content (65.5%), following or researching brands and products (62.7%), messaging friends and family (59.3%), and keeping up to date with news and current events (54.2%)
- According to eMarketer, Gen Z is the top generation to research brands, products, or services on social media, including Instagram, rather than using search engines. More than half (51%) of Gen Zers do it.
Instagram audience and demographics statistics
Let’s take a closer look at Instagram’s audience and demographics – by location, age, and gender.
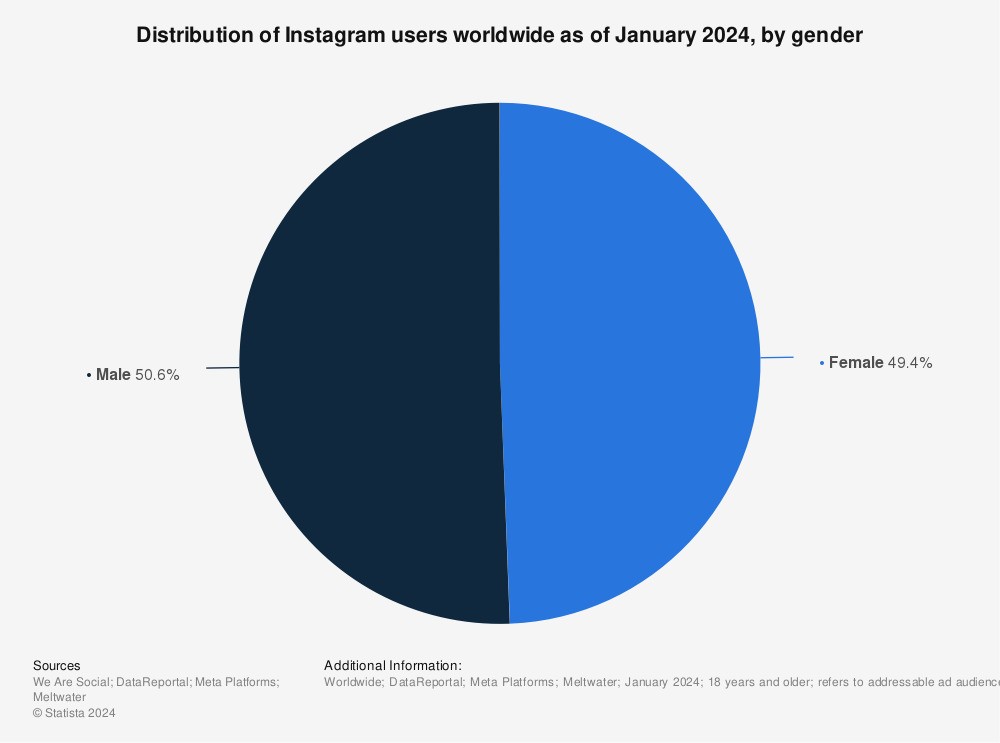
Instagram audience by location
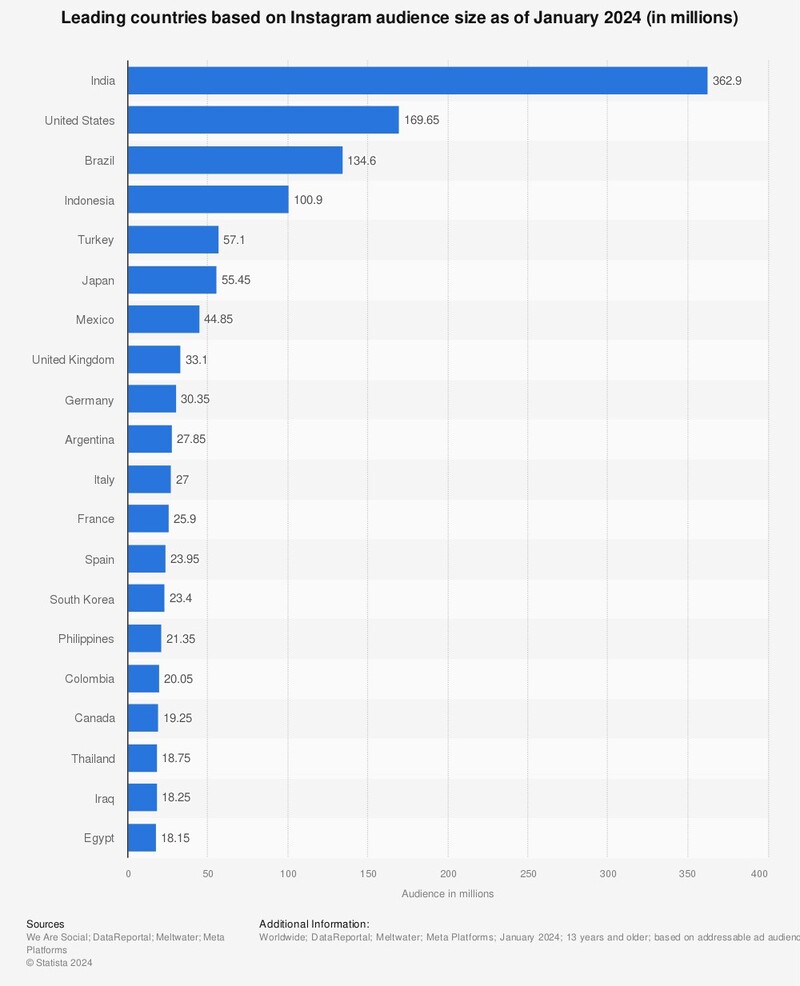
The largest audience on Instagram is by far India, with about 360 million users. When you look at Statista’s graph below, you’ll see that “by far” is not an exaggeration.
In second place comes the US, which does not even have half that number at nearly 170 million. In third place, we have Brazil, with 134 million users.
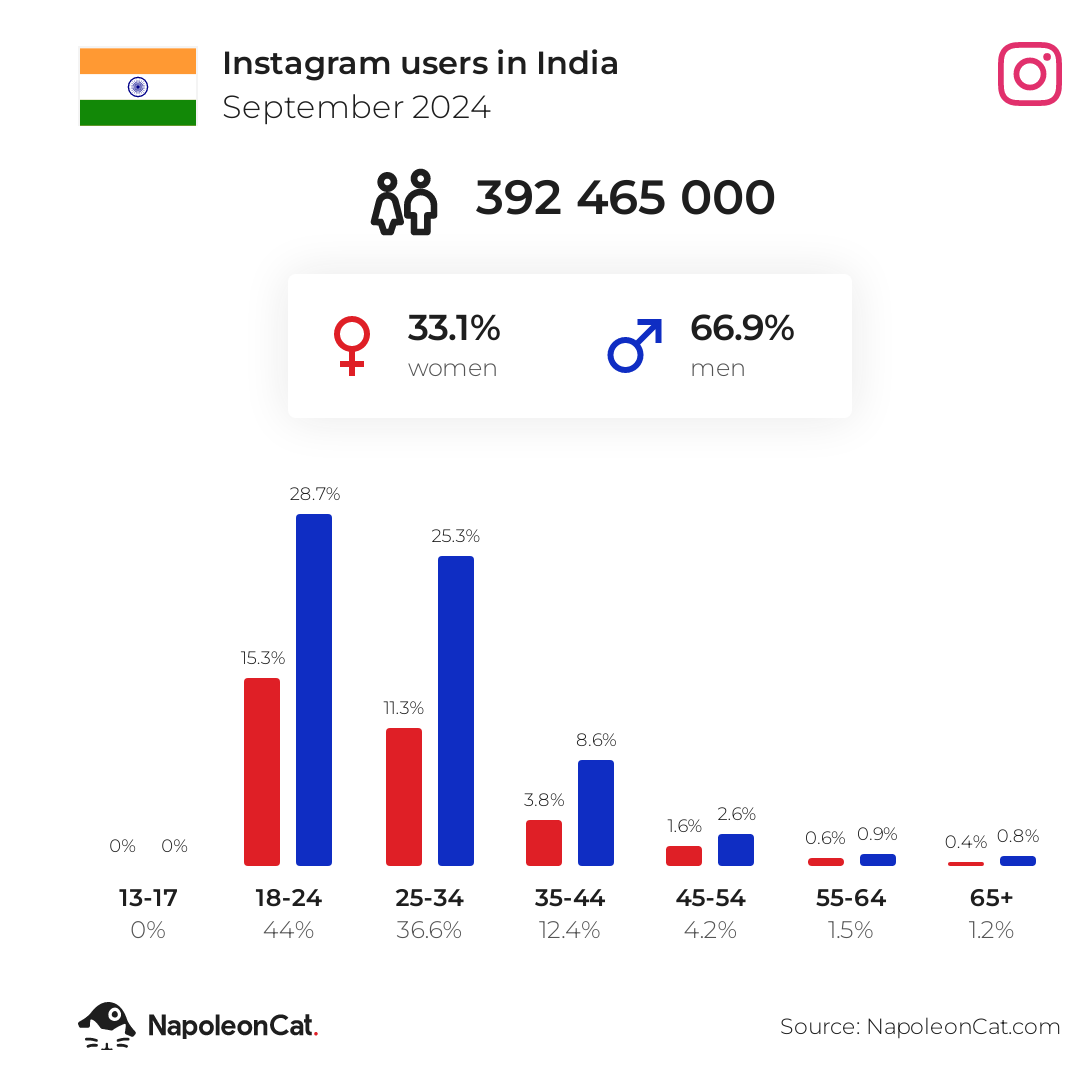
According to our most recent Instagram statistics from September 2024, the numbers for India are even higher, at 392 million. That’s about a quarter of the Indian population.
The US has over 172 million users on Instagram, with over half of them comprised of people between the ages of 18 and 34, making Gen Z and younger Millennials the largest group on the app.

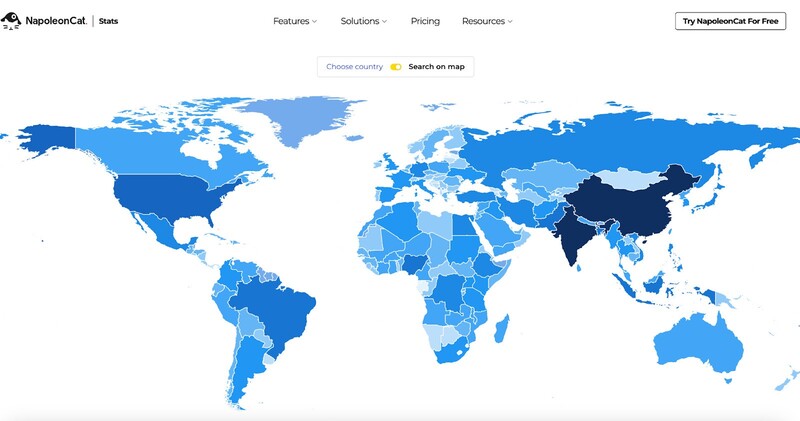
Brazil, in third place, according to September 2024 Instagram statistics, has a little over 141 million users, with a slightly more significant percentage of women vs. men (58.3% vs. 41.7%), and a more even distribution of age groups, with older Millennials (35-44) catching up with younger Millennials (who top the chart at 29.2%) and Gen Z in second place.
For more free social media user statistics (including but not limited to Instagram statistics) by location worldwide, go to our social media stats page.
Instagram audience by age
The biggest age groups of Instagram users are 18-24 (31% of users globally) and 25-34 (a little over 30% of Instagram users.) Then there’s a considerable gap, with the next age group of people aged 35 to 44 at just 16% of Instagram users globally.

As you can see from the sample stats from a few different countries, these will be slightly different based on individual locations, so check yours if you’re interested.
Instagram audience by gender
Globally, there seems to be an even distribution of male vs. female Instagram users, with 50.6% male and 49.4% female (as of January 2024).
Again, as you can tell from some of the stats above, that can vary greatly by country. The largest audience in India has a different divide – just a third of the Indian Instagram users are female, and two-thirds are male.
When it comes to the second-largest Instagram audience, which is the US, the gender distribution is much closer to the global one but skewed slightly towards women, with 55.4% female users and 44.6% male users.

Create Instagram analytics reports within seconds
Generate custom Instagram reports within seconds. Schedule automatic reports, analyze your competitors, and more – with an all-in-one social media tool.
Instagram advertising and marketing statistics
Instagram is one of the favorite social media platforms for businesses and marketers – because it’s proven to be effective in both influencing people to buy organically and using paid advertising.
Since organic reach has been far from satisfactory for many Instagram accounts these days, and some report it has even been declining, ads definitely help reach more people, including those outside of a brand’s following.
Here are some of the numbers.
- Instagram has the third-largest ad audience, with paid media placements on the platform reaching 1.69 billion users in April 2024.
- YouTube is the largest social media platform for advertising, with ads reaching 2.5 billion users per month.
- Instagram’s ad reach is growing along with its user growth. The Instagram statistics report from Kepios cites a 12.2% year-over-year increase in ad reach.
- Last year (2023), Instagram ad revenue reached $50.58 billion. Of this number, in-feed ads accounted for the biggest portion of the revenue.
- Ads on Instagram Stories made up 26.7% of the platform’s ad revenues in 2023 – up from 2022’s 26.4%. It’s worth noting that analysts expect advertisers to increase their ad spend on Instagram Stories in the near future, with revenue growth expected to outpace that of in-feed ads.
- Instagram Reels campaigns achieve almost double the audience reach compared to those on TikTok.
- Some forecasts predict this year’s (2024) ad revenue on Instagram to reach $71 billion.
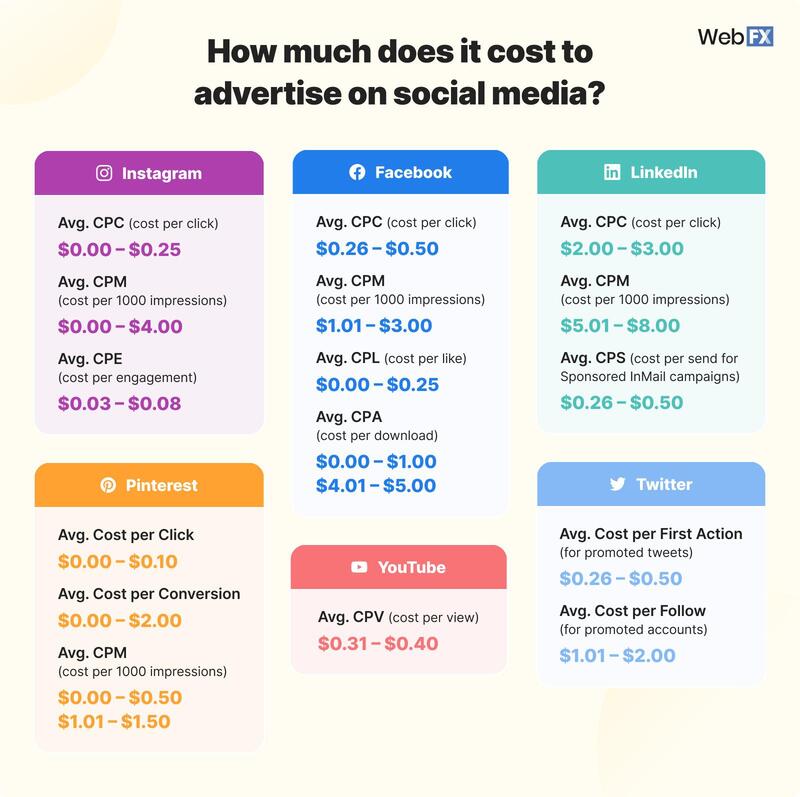
- According to WebFX, the average cost per click on Instagram ranges from $0.00 to $0.25, with an average CPM of up to $4.00.
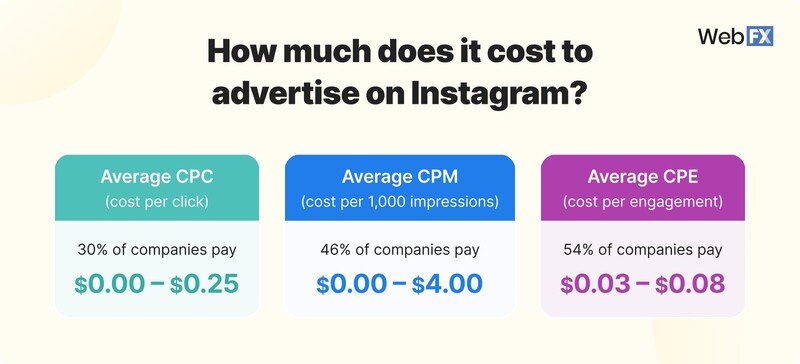
And here’s how that compares to other social media platforms:
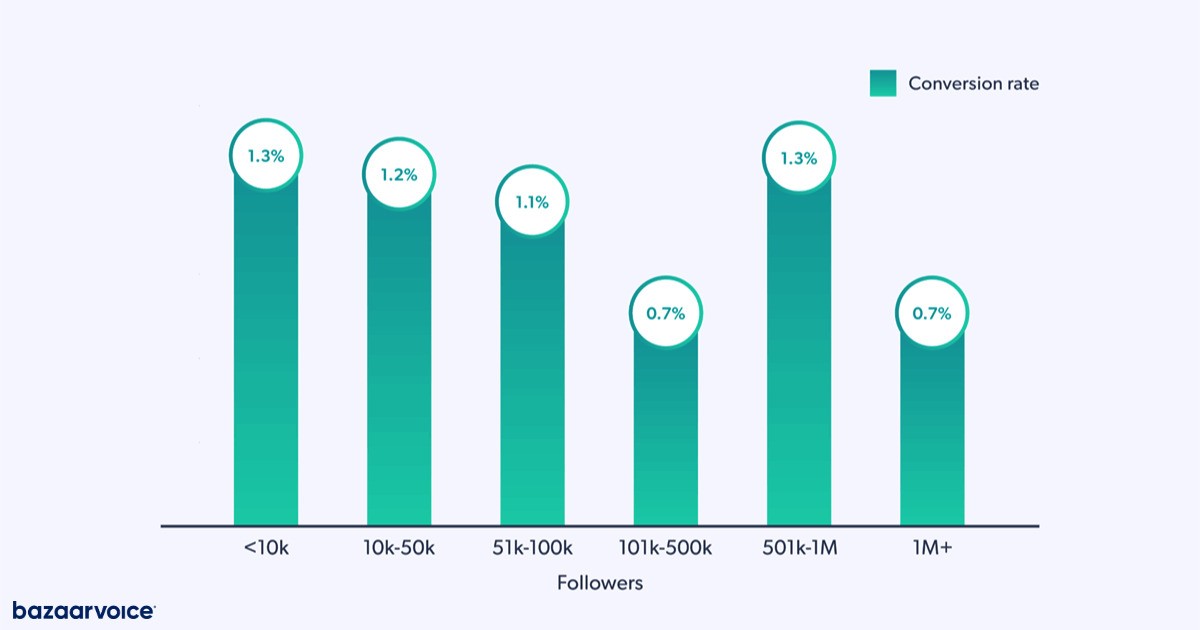
- According to the Bazaar Voice, depending on the size of the following, brands see a 1.3% conversion rate on Instagram on average (for brands with fewer than 10K followers, as well as brands with 501K to 1M followers) and 1.2% conversion rate for brands with 10K–50K followers.
Instagram Reels statistics
Instagram Reels continue to be effective and popular content formats, which is likely since they spread much more easily on Instagram than, for example, Instagram Stories and help reach people who don’t yet follow you on the platform. Here are a few interesting stats.
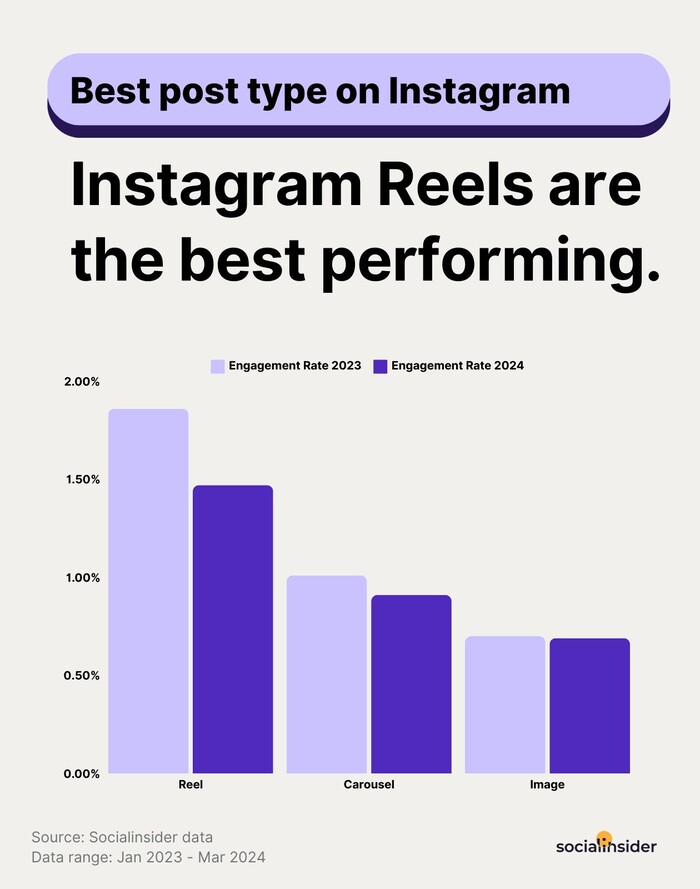
- Instagram Reels have the highest engagement rate out of all content categories on Instagram. According to Social Insider, it’s 1.48%, though it’s down from the previous year by a considerable amount (20%, according to the source.)
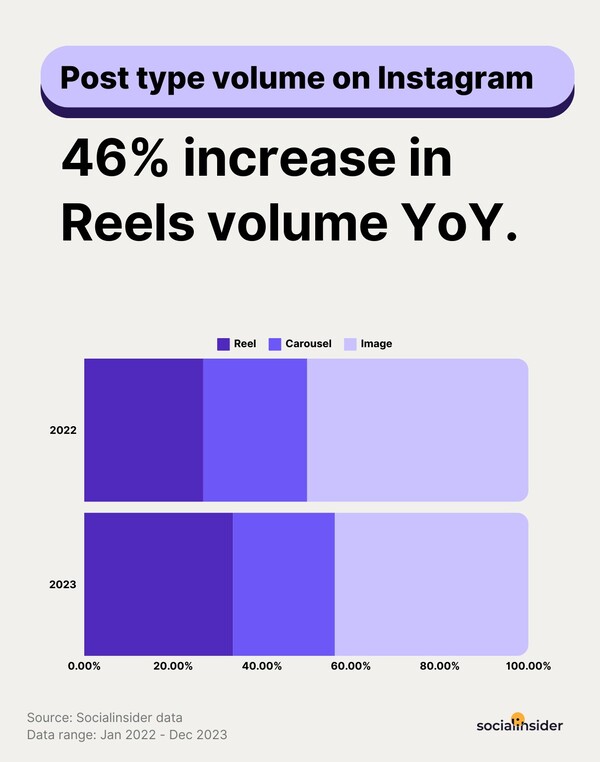
- Brands still prioritize Reels on the platform, with the volume of Instagram Reels increasing. In 2023, brands shared 46% more Reels.
- What’s interesting is that small brands get the highest views on their Reels – an average of 13.3% view rate. While large brands over 100k only get half of that number.
- According to the same source above, Reels also get the highest number of comments on average.
- Reels have a 22% higher chance of engaging users on Instagram compared to a standard video post.
- And – probably by their very nature of being much more discoverable than other types of content, Reels also have the highest reach on Instagram – by different sources, that number exceeds 30% on average when it comes to impression rates.
- 53.9% of the Instagram reel audience are males, and 46.1% are females.

Schedule Unlimited Instagram Posts, Reels, Stories, and Carousels
Schedule content across multiple Instagram accounts with an all-in-one social media tool. Reach your audience when they’re online – not you.
Instagram Stories statistics
Stories have also been a popular way to connect with followers on Instagram and have shown decent engagement rates.
(Btw, did you know that while calculating engagement for Stories, Instagram considers metrics like taps forward (to determine how often people skip a story), taps backward (to see how many users go to watch or rewatch the previous story), exits, and replies to Stories.)
- According to RivalIQ’s Instagram Stories Benchmark Report, last year brands posted a record volume of stories, which also reached more people than in the year before.
- 62% of people are more interested in a brand after viewing it on Instagram Stories. This is excellent news for brands looking to maximize their presence on Instagram.
- Smaller brands with under 10k followers saw a 35% increase in Story reach rate to 6.5%.
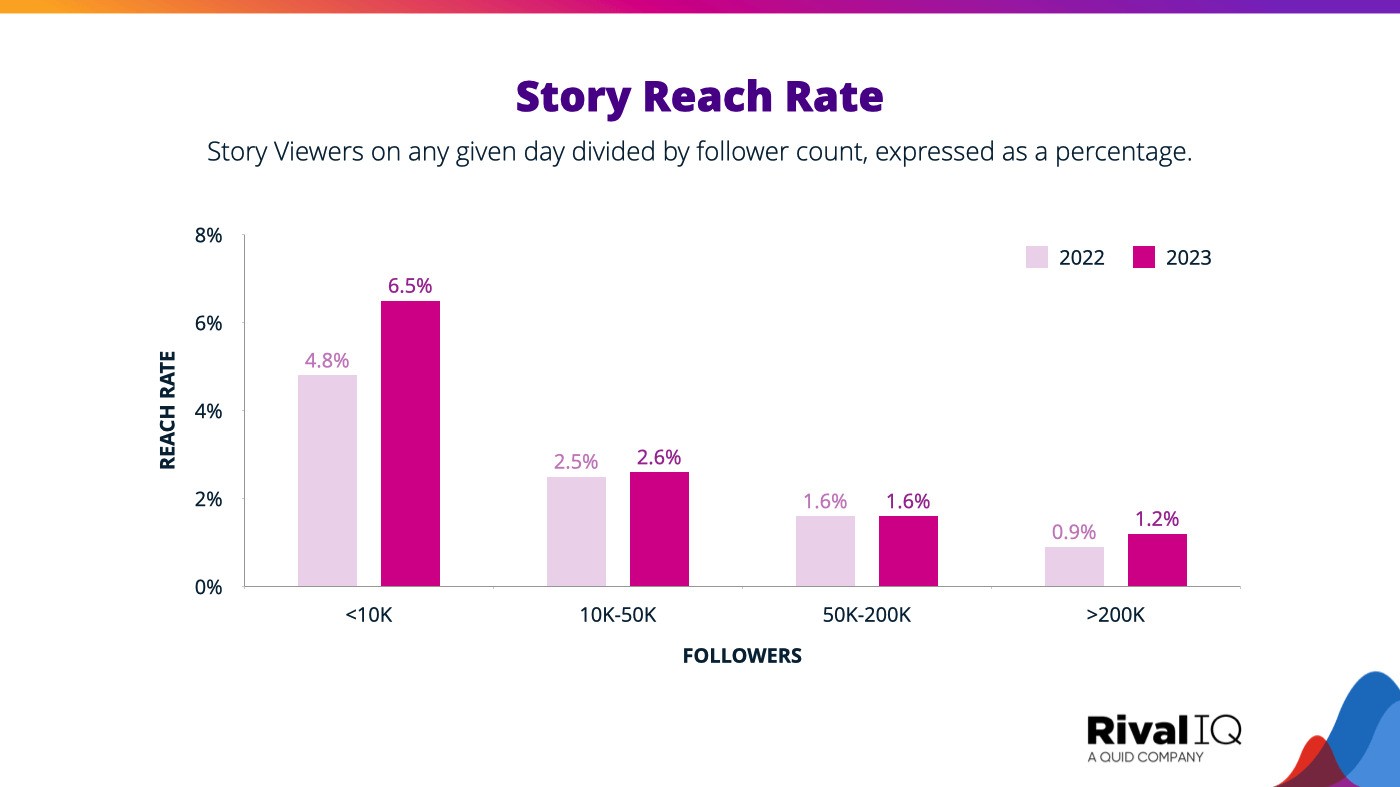
- An average brand posted an Instagram story 13 times per month.
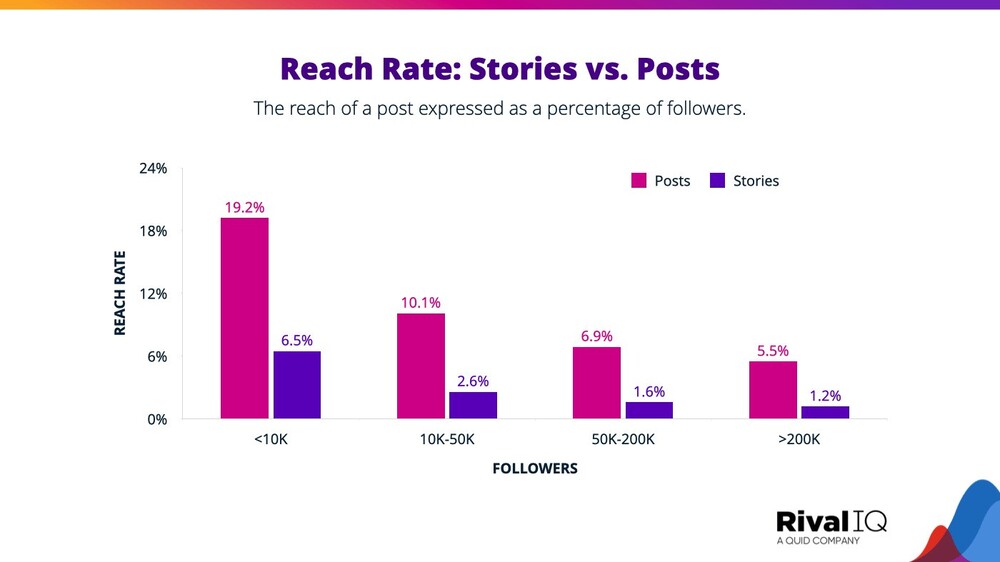
What’s interesting is that Instagram Stories continue to have a considerably lower reach than an average Instagram post.
- In the United States, 31% of brands’ Instagram advertising budgets go into ads on Instagram Stories.
- Allegedly, 70% of Instagram Stories are watched with the sound on. (It’s still a good idea to include captions, though, to account for the remaining 30%.)
Instagram Threads statistics
How are Threads doing after around two years since their launch (depending on where in the world you are)? Let’s take a look at a few numbers.
- There are currently 175 million active users on Threads:
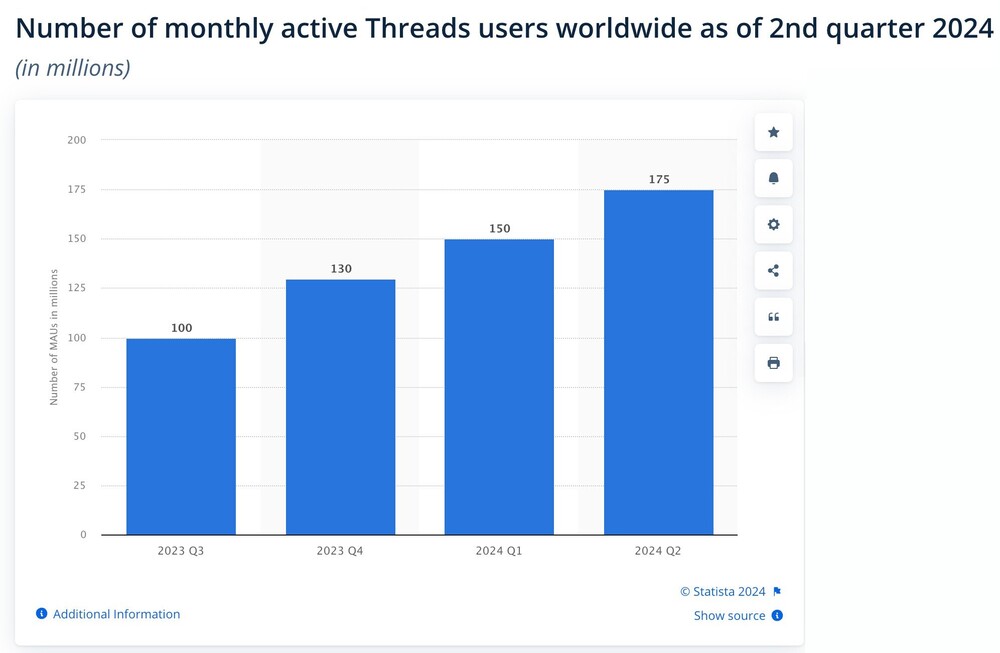
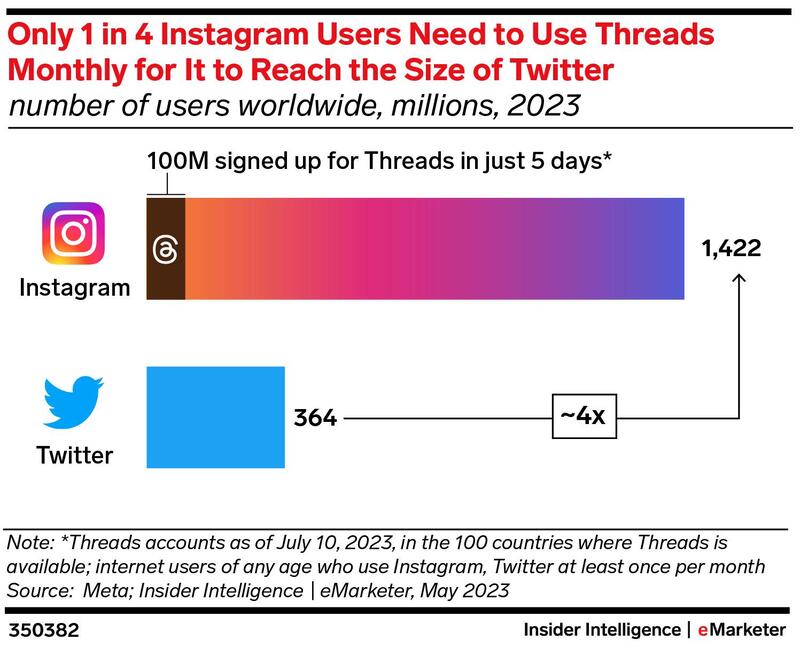
- In just five days since launch, 100M people signed up for Threads. This is primarily due to the tactic of encouraging Instagram users to sign up and making it super easy for them.
- Again, India has seen the most downloads of the Threads app, which corresponds with the location demographics for Instagram in general.
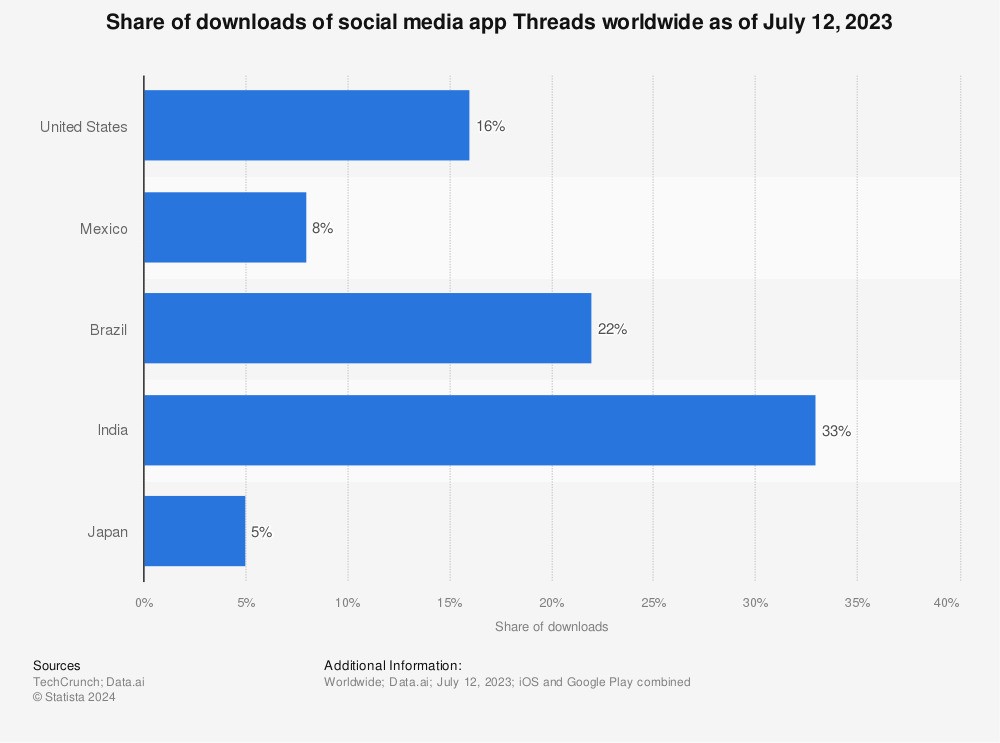
- The platform seems to struggle with user retention, though (again, possibly the result of the initial user acquisition tactic). Just one week post-launch, the app saw a 20% drop in daily active users and a 50% decline in time spent on the app.
- According to Business Insider via Social Media Today, the Threads app is seeing more daily users in the US than X (formerly Twitter), with 24 million daily active users in April 2024 as opposed to 22 million daily active users on the former bird app.
- Fun fact: Social Insider reports there was a momentary spike in Instagram Reels engagement rates related to the launch of the Threads app. According to the site, the engagement rate went up around that time, almost reaching 3%, and then fell back down in the following months.
Instagram for business statistics
Instagram is a popular place where people look for buying inspiration and are influenced to discover and purchase new products. Here are some numbers.
- Instagram’s own data shows that 70% of shoppers look to Instagram for their next purchase.
- Instagram users visit more than 200M business accounts on Instagram every day.
- 62.7% of Instagram users research or follow brands or products on Instagram. That’s the highest percentage of all social media platforms, making Instagram the top social channel for inspiring purchases for brands.
- The most followed brand on Instagram is… Instagram, with 674 million users, followed by Nike at 305 million users, and National Geographic at 283.3 million users.
- The average Instagram Business account posts 1.55 posts in the feed per day – on average.
- According to The Business of Apps, Instagram accounted for 44% of Meta’s revenue in 2023. And it’s expected to surpass Facebook as Meta’s primary revenue source by 2025.
Instagram influencer statistics
Besides encouraging people to buy products, Instagram is also the top social media platform for influencer marketing.
- 46.7% of marketers plan to use it for influencer marketing in 2024, according to the Influencer Marketing Hub via Oberlo
- When it comes to the influencer marketing platforms brands use, Instagram is now second to TikTok.
- According to the Influencer Marketing Hub, Instagram yields the highest ROI for influencer marketing, according to 30% of marketers who use the platform.
- There are over 500,000 active influencers on Instagram.
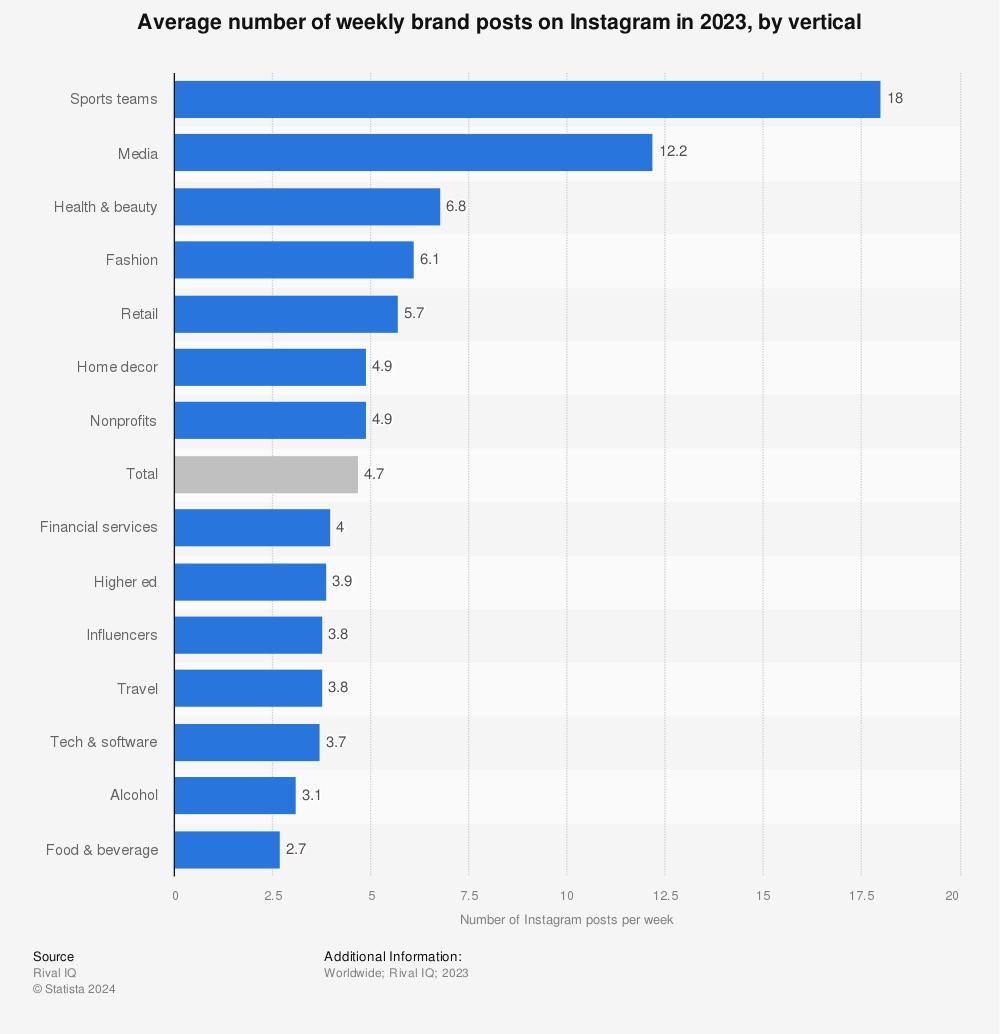
- Statista has named Instagram the “influencer’s comfort zone,” as the app not only facilitates discovering influencers by brands, but also makes reaching out to them super easy. As of last year (2023), the average number of sponsored weekly posts by a brand on Instagram was around five. This contributed to the global Instagram influencer market becoming a 17-billion-dollar business.
How to make Instagram work better for your business
Apparently, Instagram continues to be super effective for brands and content creators alike, facilitating profitable brand deals and collaborations. But how do you maximize that potential and get the best results for your business?
Use NapoleonCat’s Instagram management tools for business that let you:
- Boost engagement by replying to comments and DMs in one Social Inbox, including comments on Instagram ads
- Auto-moderate some of those replies, for example, when people reach out with common questions
- Automatically remove spam and offensive comments (including on ads)
- Schedule and automatically post all kinds of Instagram content in a shared social media calendar, including posts, carousels, Reels, and Stories.
- Analyze and report on your numbers and compare them with competitor results.
We highly recommend you test NapoleonCat completely for free – no credit card required 😉
Simplify Instagram Business
Management with One Tool
- Manage & reply to comments and DMs in one place.
- Monitor ad comments from multiple accounts.
- Automate answers to repetitive questions.
- Schedule posts to multiple accounts, on desktop.
- Analyze performance and monitor hashtags.
- Keep track of your competition.
- Create or schedule in-depth reports in seconds.
FAQs
What generation uses Instagram the most?
According to Instagram statistics, Gen Z and younger Millenials are the generations using Instagram the most. The biggest age groups using Instagram are people aged 18-24 (31.7%) and 25 to 34 (25-34).
What is the breakdown of Instagram users by age?
- People aged 18-24 make up 31.7% of Instagram users globally.
- People aged 25-34 constitute a little over 30% of Instagram users.
- The next age group is people aged 35 to 44 at just 16%.
- People aged 45-54 are at 8.7%.
- Instagram users aged 55-64 amount to just 4.6%.
- And people aged 65 or over make up only 2.9% of the platform’s users.
What is the breakdown of Instagram users by gender?
Globally, there’s an even distribution of male vs. female users on Instagram, with 50.6% male and 49.4% female (as of January 2024.)
These stats can vary by country, so to check the breakdown of Instagram users by gender for your specific location, go to stats.napoleoncat.com and select your preferred location.
You may also like:
- Marketing Automation Statistics You Should Know
- How to Create an Instagram Analytics Report
- How to Track Instagram Follower Count Over Time
- How to Analyze Competitors on Instagram
- Here’s the Best Time to Post Reels on Instagram
- Here Are The Best Times to Post on Instagram
- How to Create a Social Media Report Without Breaking a Sweat