
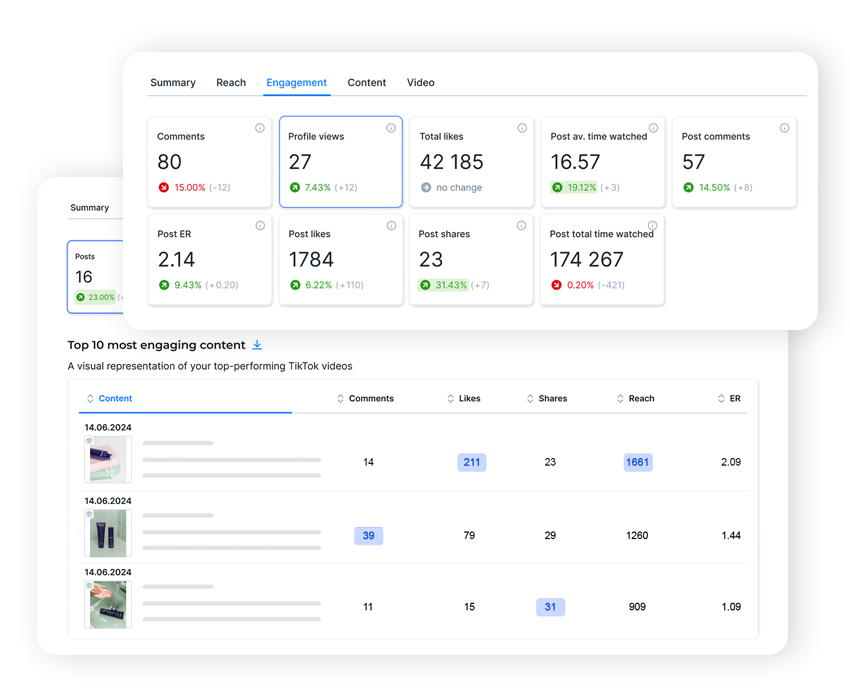
Need easier access to Instagram insights for all your accounts? With NapoleonCat’s Instagram analytics reports, you’ll see all important KPIs across all your accounts, in one convenient dashboard.
Instagram Analytics Report Tool – All Your KPIs in One Place
Trusted by:


Supported platforms








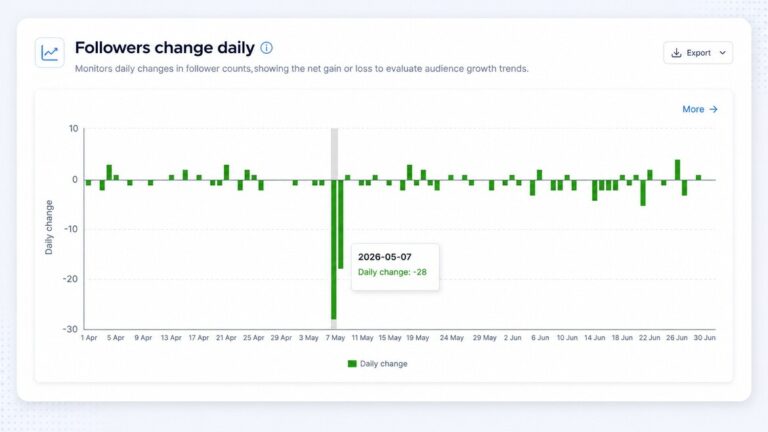
Track reach, engagement, and follower growth in one place
NapoleonCat’s Instagram reporting tool has a significant advantage – it comes together with your management tools, letting you quickly see all the important metrics for any of the accounts you manage.
Without changing tools and relogging between profiles, with all the info you’re looking for in one place.
The same numbers are there to browse outside a report, too. Open your Instagram statistics whenever you need them instead of waiting for the next PDF to land.
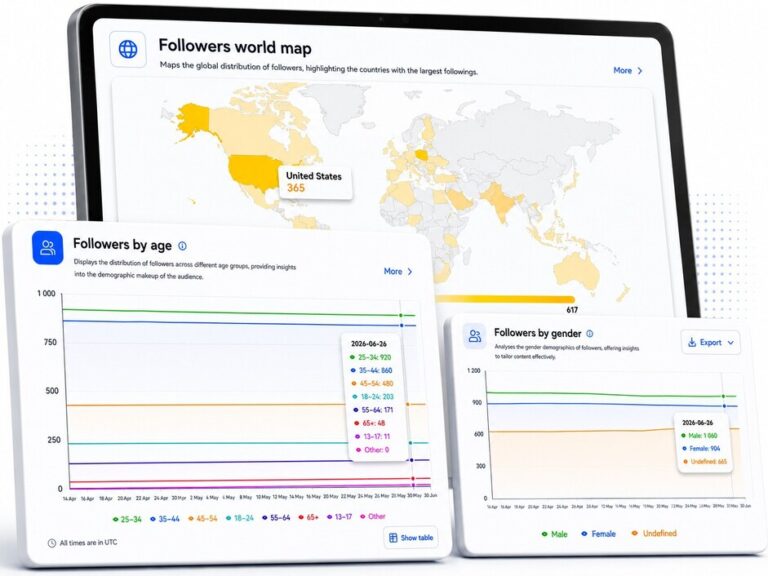
Schedule your Instagram performance report to send itself
Forget about copying, pasting, screenshotting, and putting it all in your Instagram analytics report template or spreadsheet every week.
With NapoleonCat, you pick the Instagram account(s) and the metrics you want to include in a report, and schedule it to be automatically generated every week, month, or quarter, in a professional-looking PDF. And it will even get automatically emailed to you and anyone else who needs to see it.
Prefer to build it by hand? Our free Instagram analytics report template is yours to copy – it works out follower growth rate and engagement rate for you.
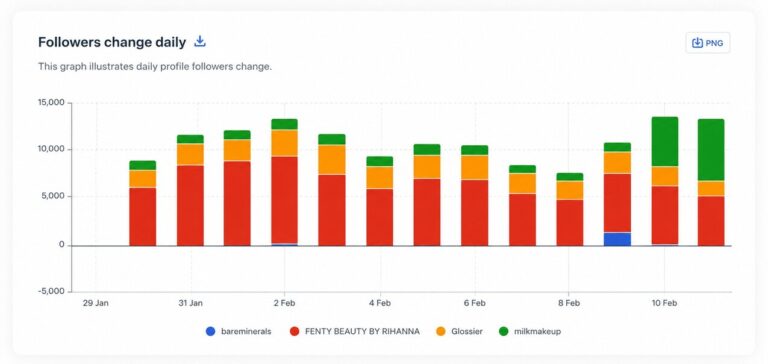
Benchmark your Instagram results against rival accounts
You can also track the performance of Instagram accounts you don’t manage, including your competitors. See followers, engagement, content, and more, and easily compare your numbers to theirs to inform your Instagram marketing strategy.
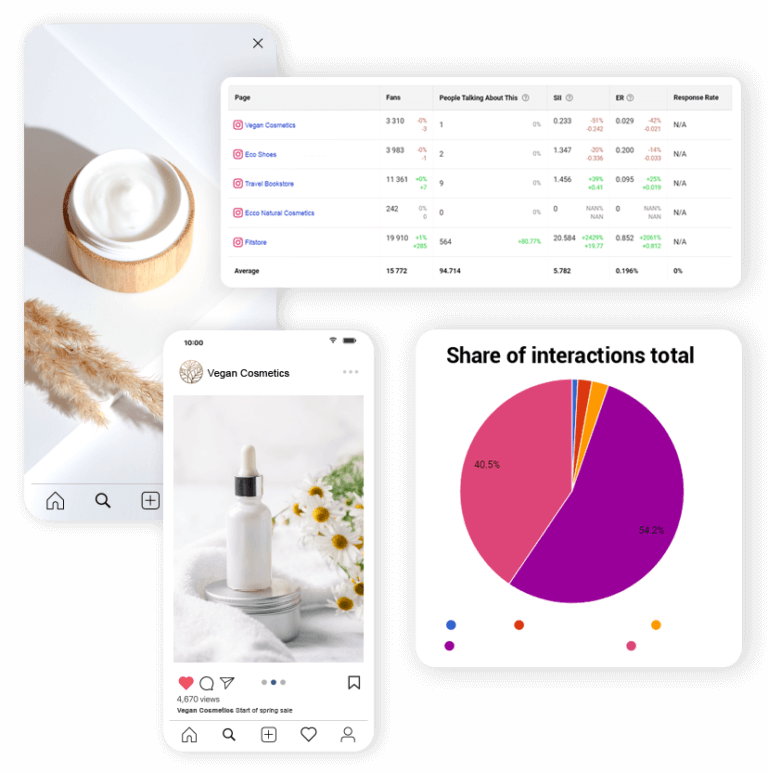
Report on every Instagram account from one dashboard
No matter how many clients or brands you work with, you can manage and track performance for all of them using NapoleonCat’s Instagram analytics. Compare, filter, and report using one platform with workspaces to separate clients if you need to.
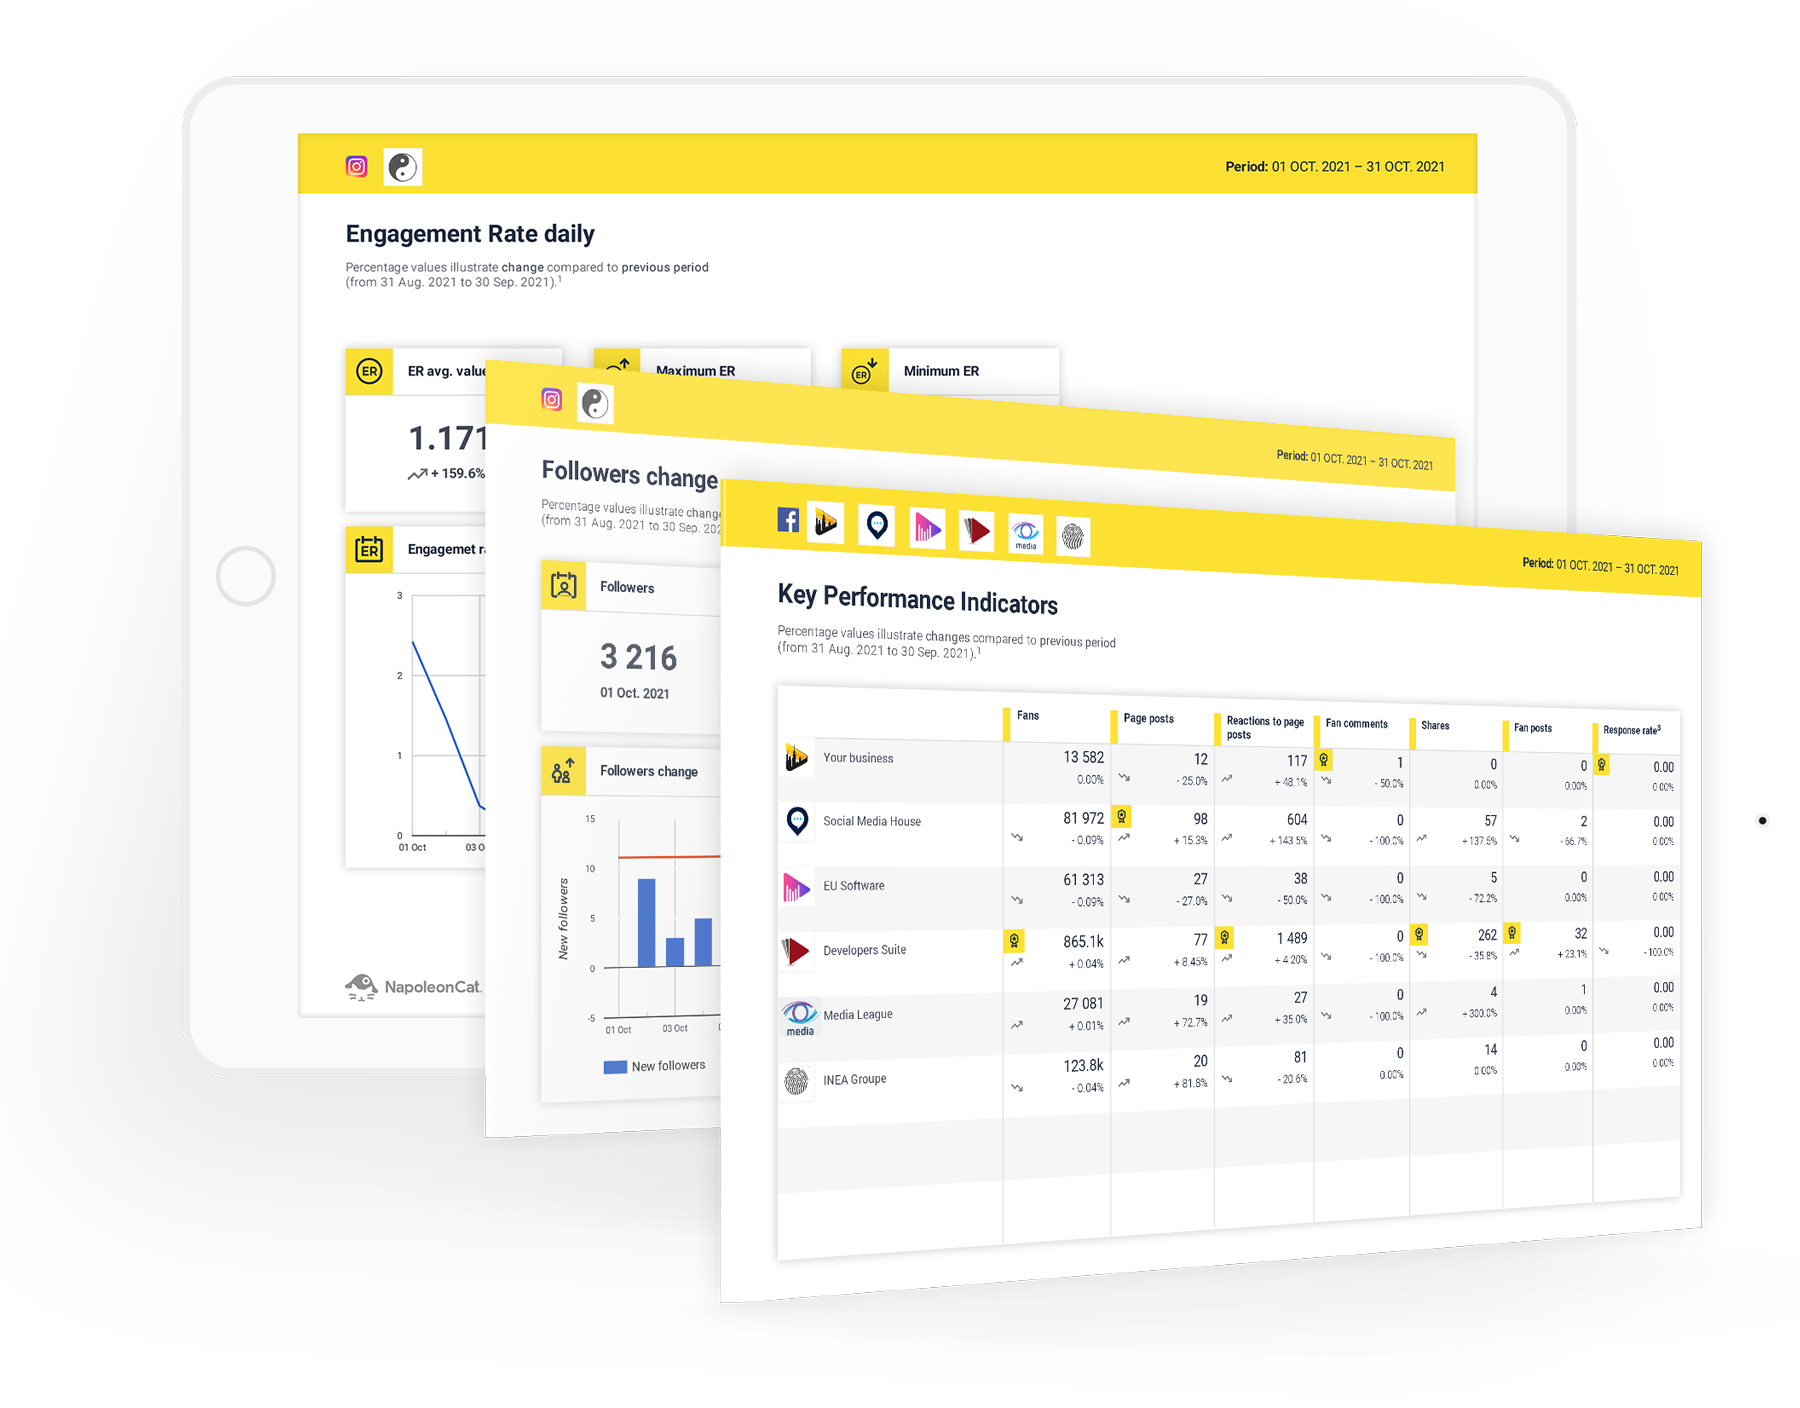
Deliver client-ready PDF and presentation-ready reports
NapoleonCat puts together Instagram performance reports for you, complete with graphs and charts, and even your logo (or your clients’ logos).
It’s like having an agency create the Instagram analytics report for you, it just happens with a few clicks of a button (and time saved for your graphic designer and analyst).
Try all Instagram management tools in NapoleonCat




Here’s why our clients love NapoleonCat
Join businesses that report on Instagram in minutes, not hours.

NapoleonCat saves up to one-third of a full-time position. That’s time we would otherwise spend manually moderating thousands of comments each month using the Meta Business Suite, profile by profile and comment by comment. Time we can now use for growth. NapoleonCat is the best tool of its kind on the market, and it’s still constantly evolving and improving by introducing new AI features.

It’s hard to imagine our work without a tool that includes so many valuable features. It won’t be an overstatement when I say that NapoleonCat saves us multiple full-time positions that would be dedicated to just moderating comments or manually generating reports.

NapoleonCat gives us the full picture of social media interactions. It’s easier to pick up urgent threads that need taking immediate action. And with conversation history, it’s much easier to continue the work of another team member while they’re out of office.

We work with multiple clients, and with NapoleonCat, we don’t waste time switching between multiple software tools. We can also deliver reliable data from a single source. We tested other social media moderation and analytics tools before, but none of them lived up to what NapoleonCat delivers. They’re the best, and I personally love using the tool. 🙂

NapoleonCat is now an indispensable tool that we use for moderation and analytical purposes, as well as content publishing. We’re curious to see new capabilities of the tool and test its new uses, for example, to moderate TikTok ad comments, as we predict this social media channel to become more and more important for our clients.

It’s the first social media engagement tool we have ever tried that is truly intuitive and that makes it easy for us to include the clients in the process. The service and support is great and personal. And the value for money is great!

We were looking for a tool that would allow us to consolidate and manage comments and private messages from Messenger in one place. Analytics and reports were also very important to us, as they would show us the level of our social media customer service. That’s why, in 2017, we decided to choose NapoleonCat.
See how NapoleonCat compares to its alternatives:
| Feature | NapoleonCat | Hootsuite | Sprout Social | Agorapulse |
|---|---|---|---|---|
| Instagram Metrics For All Managed Accounts In One View | ✅ Yes (all profiles, one dashboard) | ✅ Yes | ✅ Yes | ✅ Yes |
| Competitor Instagram Account Tracking | ✅ Yes (on every plan) | ⚠️ Higher tiers | ✅ Yes | ❌ Custom plan add-on |
| Audience Demographics (Location, Age, Gender) | ✅ Yes | ⚠️ Basic | ✅ Yes | ⚠️ Basic |
| Historical Data Retention | ✅ 24 months on every plan | ⚠️ Varies by plan | ✅ Deep historical data | ⚠️ 6 months on entry plan |
| Automated Scheduled Reports (Weekly, Monthly, Quarterly) | ✅ Yes (auto-generated and emailed) | ⚠️ Limited / add-on | ✅ Yes | ⚠️ Higher tiers |
| White-Label PDF Reports With Your Logo | ✅ Yes (on every plan) | ⚠️ Higher tiers | ⚠️ Higher tiers | ⚠️ Higher tiers |
| Analytics + Moderation In One Platform | ✅ Yes (Social Inbox + Auto-moderation) | ⚠️ Limited moderation | ⚠️ Limited moderation | ⚠️ Limited moderation |
| Moderation Of Ad Comments (Facebook, Instagram, TikTok) | ✅ Yes | ⚠️ Limited | ❌ No | ⚠️ Professional plan and up |
| Pricing Model | ✅ Per account (2 users and 5 profiles included) | ❌ Per user | ❌ Per seat | ❌ Per user |
| EU-Based, GDPR-First Hosting | ✅ Yes (data stored in the EEA) | ❌ CA-based | ❌ US-based | ✅ EU (AWS Ireland) |
| Starting Price | From $79/mo billed yearly (2 users, 5 profiles) | From $99/user/mo billed yearly | From $79/seat/mo (Essentials); $199/seat/mo (Standard) | From $79/user/mo billed yearly |
FAQs
What Instagram metrics can I track in NapoleonCat?
You get the KPIs that actually matter for reporting: follower growth (gains and losses), reach and impressions, engagement and engagement rate, post and Reels performance, profile activity, hashtags, and audience demographics like location, age, and gender. You can view them per account or compare several Instagram accounts side by side, and pick exactly which metrics land in your report.
What should an Instagram performance report include?
At minimum: follower growth broken into gains and losses rather than just the net number, reach and impressions, engagement and engagement rate, your top-performing posts by format, and audience demographics. Add profile views and website clicks if Instagram sits on a conversion path, and Stories completion rate if Stories are a big part of what you publish. What turns a data dump into a report is the commentary – two or three sentences on what worked, what did not, and what you are changing next month.
Can I schedule Instagram reports to send themselves?
Yes. You choose the Instagram account(s), the metrics, and the time frame, then set the report to be generated automatically every week, month, or quarter. NapoleonCat builds the PDF and emails it to you and anyone else on the recipient list – no manual exporting, screenshotting, or spreadsheet work.
Is there a free Instagram analytics report template I can use?
Yes – we built one and it is free, with no email required. It is a spreadsheet with tabs for account metrics, post and Stories performance, audience demographics, and competitor benchmarking, and it works out follower growth rate, engagement rate, and period-on-period change for you. It is a good way to run your first few Instagram performance reports and find out which metrics your client or your boss actually reads. Make your own copy of the free Instagram analytics report template here. Once you are reporting on more than an account or two, the copy-paste stops being worth it – that is the point where automated reports pay for themselves.
Can I track Instagram accounts I don’t manage?
Yes. Competitor analytics lets you add public Instagram accounts you don’t own and track their followers, engagement, and content performance. You can then benchmark your own results against theirs in the same view, which makes it easy to see whether a drop is your account or the whole category.
Can I white-label reports for my clients?
Yes. Reports come with graphs and charts already laid out, and you can add your own logo or your client’s logo. The output is a professional-looking PDF you can send straight to a client or drop into a presentation, without involving a designer.
How do I choose an Instagram reporting tool?
Three things settle it in practice. First, how many accounts you manage – a free Instagram report tool is fine for one profile and painful for ten. Second, whether reports can be scheduled and delivered without you touching them, because manual reporting is the task that quietly eats a day a month. Third, whether the tool does more than analytics: if the same platform also handles your comments, DMs, and moderation, you stop paying for two subscriptions and stop switching between them.
Does NapoleonCat cover more than Instagram?
It does. The same account gives you analytics and reporting for Facebook, LinkedIn, TikTok, YouTube, X, and Google Business Profile, so cross-channel reports live in one place. You also get the engagement side – Social Inbox for comments, DMs, and reviews, plus Auto-moderation – instead of paying for separate analytics and moderation tools.
How do I get started with Instagram analytics reports?
Start a 14-day free trial – no credit card required – and connect your Instagram accounts. Analytics data is available from the moment your profiles are connected, and it’s retained for 24 months, so your reports keep a full year-on-year view. If you’d rather not set it up alone, you can book a demo or lean on the knowledge base and NapoleonCat Academy courses.
Report on Instagram without the copy-paste
Free 14-day trial: full access, zero commitment.
No credit card required