Table of Contents
- What is Facebook analytics?
- Top benefits of using Facebook analytics
- Key Facebook analytics metrics to monitor
- How to track Facebook analytics using Facebook Insights
- How to track Facebook analytics with NapoleonCat
- Expert tips for getting the most from Facebook analytics
- Best Facebook analytics tools to consider in 2025
- What Facebook analytics tool to choose?
Facebook keeps changing, and so do Facebook analytics tools and options. Here’s a roundup of how you can track performance and audience metrics for your Facebook business pages using Facebook’s native tools and the Facebook analytics tool in NapoleonCat.
- What is Facebook analytics?
- Top benefits of using Facebook analytics
- Key Facebook analytics metrics to monitor
- How to track Facebook analytics using Facebook Insights
- How to track Facebook analytics with NapoleonCat
- Expert tips for getting the most from Facebook analytics
- Best Facebook analytics tools to consider in 2025
- What Facebook analytics tool to choose?
In-depth Facebook Analytics Tool
Analyze your own pages and track your competitors. Generate in-depth Facebook reports in second (even for multiple Pages at once) – with an all-in-one social media tool.
What is Facebook analytics?
Being on Facebook as a brand and not analyzing the results is not a smart move. And that’s what Facebook analytics is for.
Now, the original Facebook Analytics used to be a free tool that hasn’t been available for around three years now. But fortunately, there are other ways to analyze your performance on Facebook, and in this article, we’ll take a look at two in particular: the native Facebook Insights in the Meta Business Suite, and the Facebook analytics tool available in NapoleonCat.
Top benefits of using Facebook analytics
Just as with any social media platform or, in fact, any marketing channel, analyzing performance is key to being able to:
- See if your content strategy is working. When you analyze results, you’ll see if what you post matches what your audience is looking for, what kinds of topics and content formats work and which don’t, and how to organize and schedule your content for optimal visibility and engagement.
- Get to know your audience in the first place. So you can create more relevant content and post it when your audience is most likely to get engaged. Creating Facebook content without digging into your audience analytics on a regular basis is like throwing spaghetti at the wall and seeing what sticks.
- Tweak your strategy and content plan to improve performance. You know what they say, you can’t improve what you can’t measure. When you regularly track your content performance, you can monitor your KPIs and look for other ways to achieve your marketing goals.
- Compare performance against your competitors. Tracking Facebook analytics not just for your Facebook pages, but also for your competitors’ pages, is super helpful for benchmarking and positioning your brand on social media. You can also find what works for others and look for ways to adapt (but not copy) it to your Facebook content strategy.
- Share your wins and progress with clients/stakeholders. If you need to report on your results to others, you obviously can’t do it without a good dig into the numbers. And the more details you have, the more compelling your weekly or monthly reports can be.
Key Facebook analytics metrics to monitor
I always say this, and I’ll say it now, too: which Facebook analytics metrics are key for your brand really depends on your marketing goals. But for the sake of this article, let’s look at some important metrics to track in general.
1. Engagement
And by engagement, I mean all the metrics that show how people interact with your Facebook content, including:
- likes and other reactions
- comments
- shares
- clicks to your profile
- your overall engagement rate.
Engagement is the top metric (or set of metrics) for any social media platform, showing if your content gets people talking about your brand and builds the relationships with your audience that you’re hoping for. Plus, the more engagement your Facebook content gets, the more people will eventually see it, so it’s also important for increasing your reach.
2. Reach
Another thing to track is how many people see Facebook content. Reach is important, but can sometimes also be seen as a vanity metric when considered in isolation, so watch out for that. What’s more important than how many people see your content or Facebook ads is whether the right people see it, and, most of all, how that translates to other outcomes for your business – from brand awareness to clicks, sales, and loyalty.
3. Impressions
Impressions are the number of times your Facebook posts are displayed in someone’s feed. The number can be higher than reach itself purely because someone can see your content more than once, which will also count as impressions.
4. Facebook page likes and followers
This includes your follower growth over time, and again, seen in isolation might become a vanity metric – especially if you have a high number of followers who are not engaged (and most likely don’t even see your organic content.)
5. Follower demographics
Understanding your audience is super important in marketing – and looking at your follower demographics on Facebook is an important piece of that puzzle. This will inform things like your content and your schedule, depending on where your potential customers are in the world, to help you measure the best times to post your content on your Facebook Page.
6. Facebook referral traffic
Measuring traffic coming from Facebook to your website is something that will show you how well your social media strategy is working for your business. This is something you should regularly track in your website’s analytics, along with conversions coming from Facebook, to analyze against the potential vanity metrics like reach or follower count.
7. Facebook ad analytics
If you run Facebook ad campaigns often, you’re likely familiar with metrics like CTR and CPM – they’re key to evaluating the effectiveness of your social media marketing strategies and optimizing campaigns to better use your advertising budget.
Of course, there’s many more metrics to follow, but I’ll show you some examples while we talk about using Facebook page analytics tools in practice.
How to track Facebook analytics using Facebook Insights
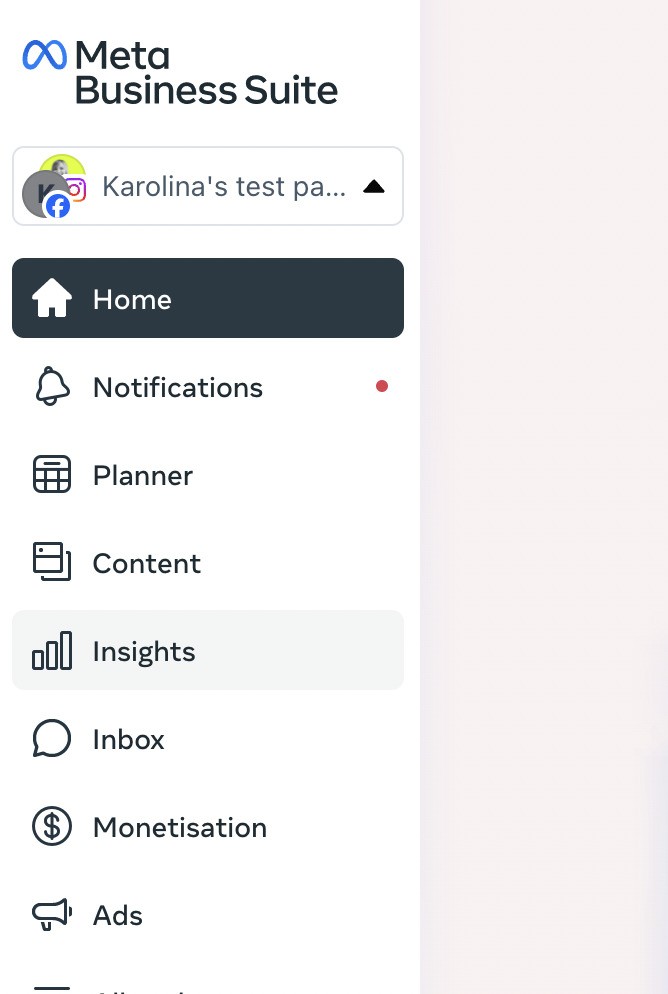
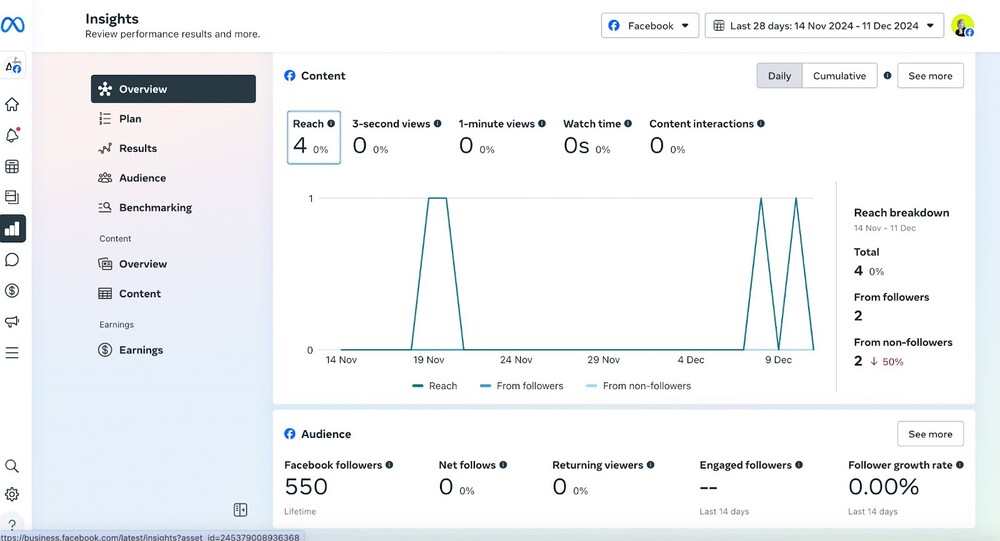
To track Facebook analytics with Meta’s free Facebook analytics tool, you need to go to the Meta Business Suite first, and then go to Insights in the left-hand menu.
You’ll first see an overview of your performance from the previous week, including your activity and overall results:
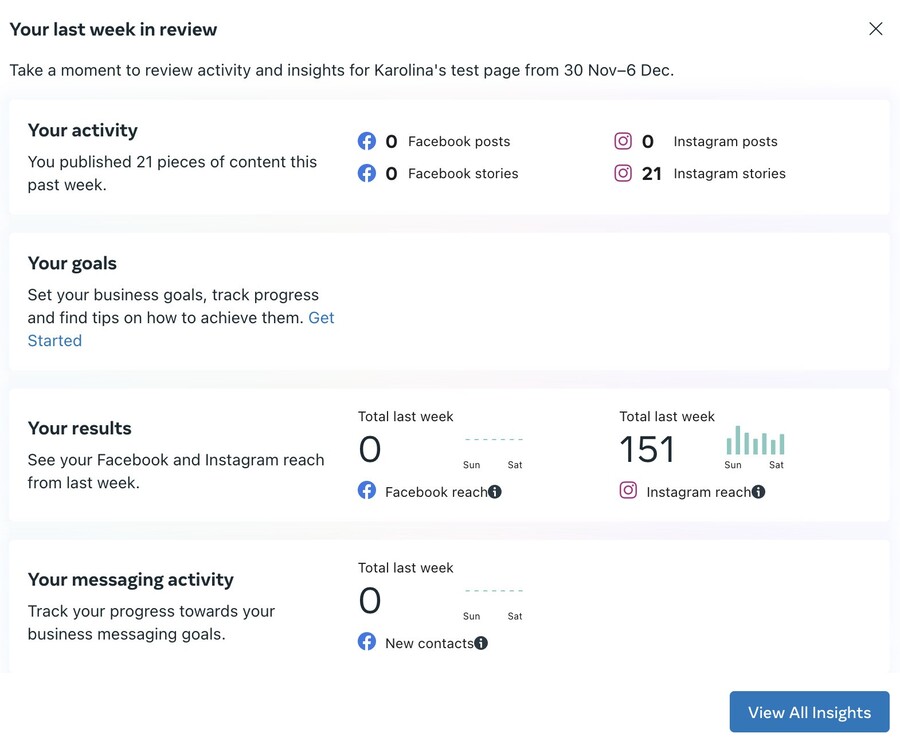
In the Overview, Meta’s Facebook page analysis will show you your reach, content views and interactions, and follower growth rate.
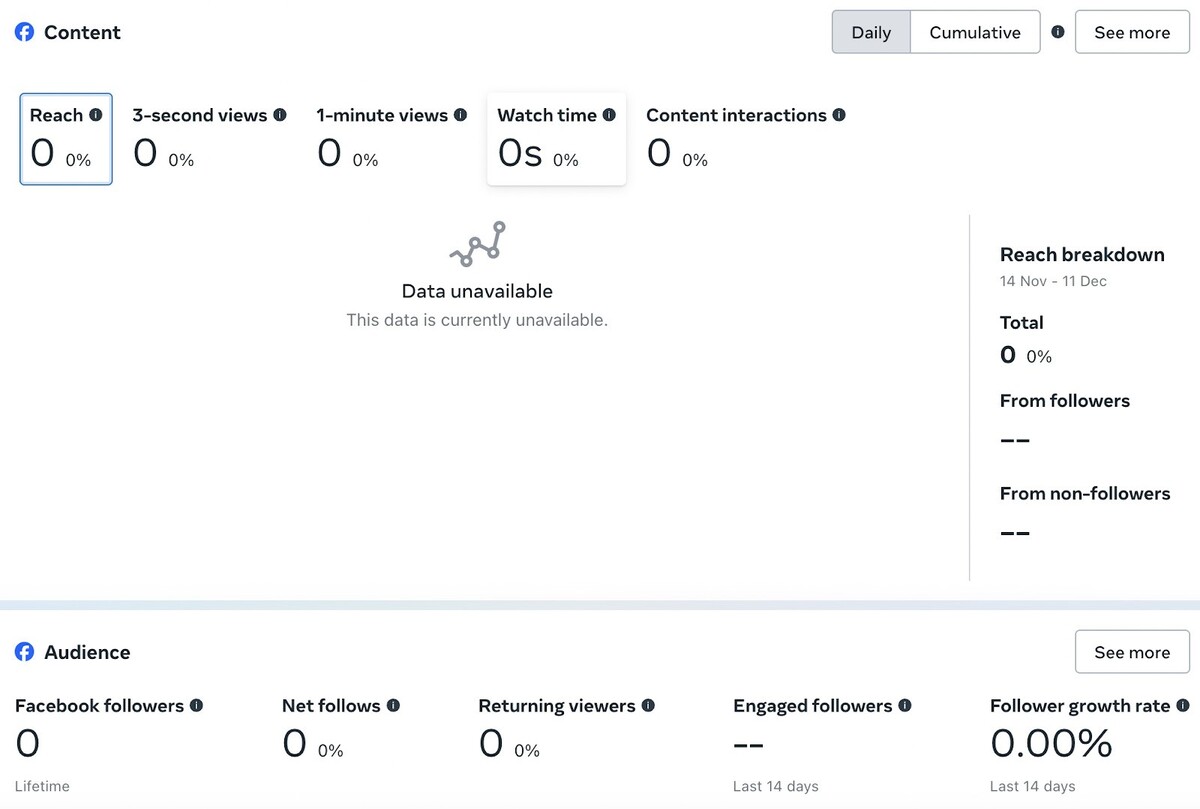
You can see more detailed information when you click “See more” in the “Content” and “Audience” sections, including:
- Stats for different types of Facebook content, including Reels, Stories, and Facebook posts performance
- Top most engaging content formats on your Facebook Page
- Audience retention statistics, which include numbers on 3-second and 15-second views of your content
- Detailed stats for individual posts
- Your follower activity, including unfollows, returning viewers week by week, and engaged followers.
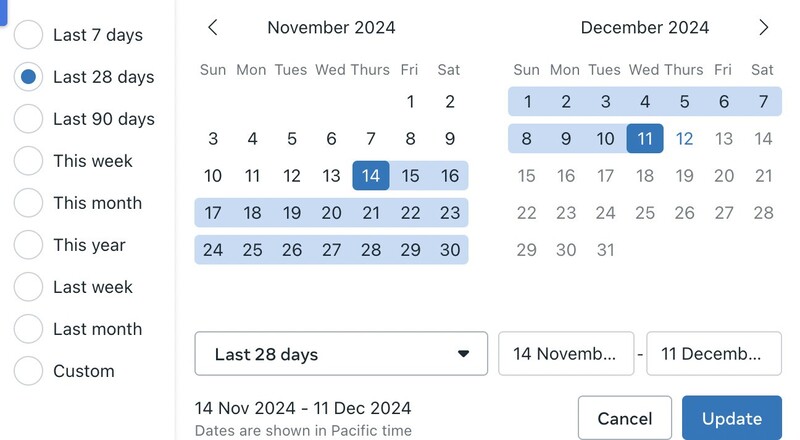
You can also view your Facebook page analytics for a selected time period:
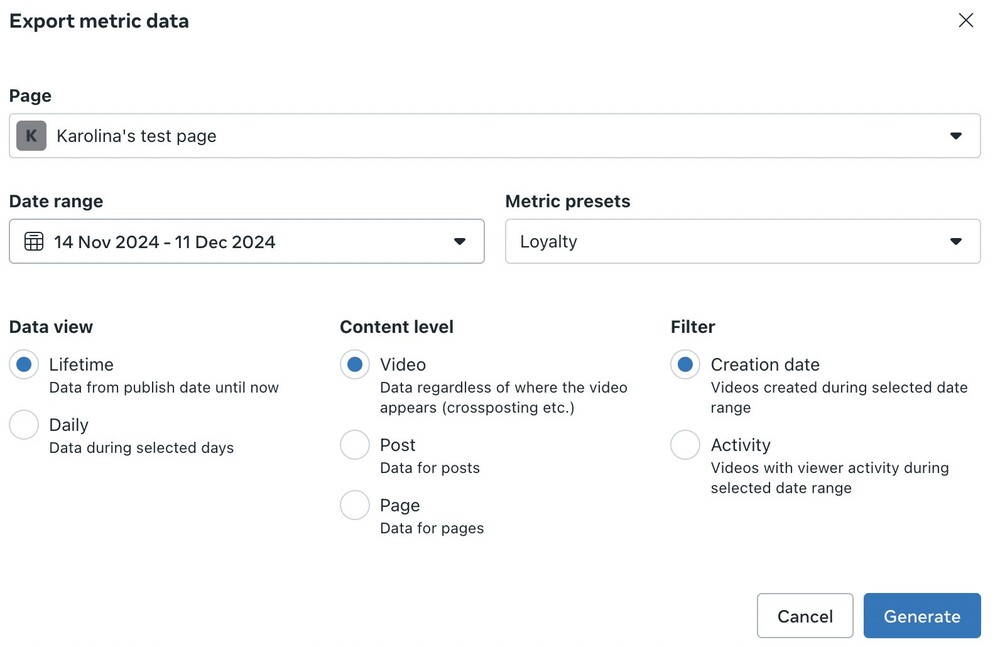
And export data into Facebook reports for your business pages:
How to track Facebook analytics with NapoleonCat
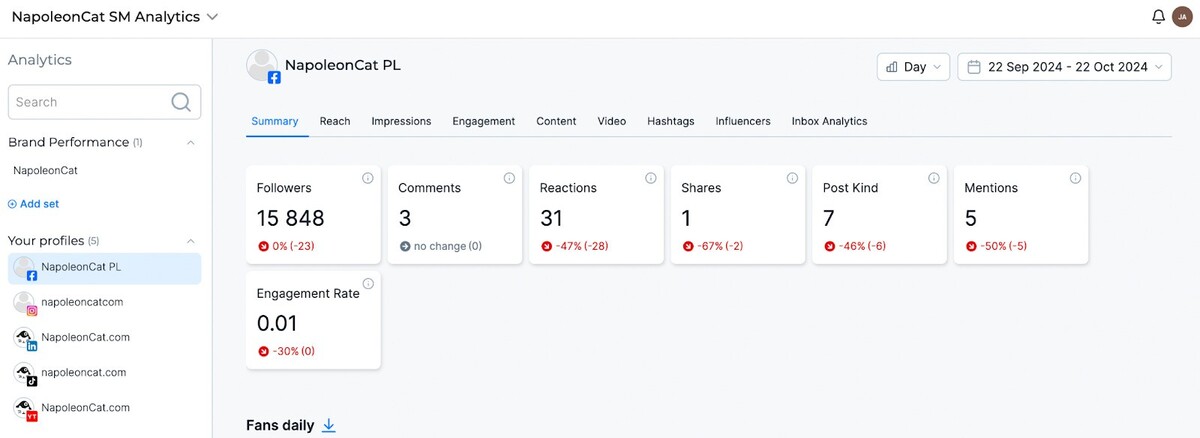
Another way to view your Facebook analytics is by using a social media management tool like NapoleonCat, where you can also see a detailed Facebook page analysis (and stats for your other social media marketing channels, all in a single dashboard.)
Here’s how NapoleonCat’s Facebook page analyzer works:
Go to the Analytics tab in NapoleonCat’s left-hand menu and pick a Facebook page you connected to view a detailed analysis.
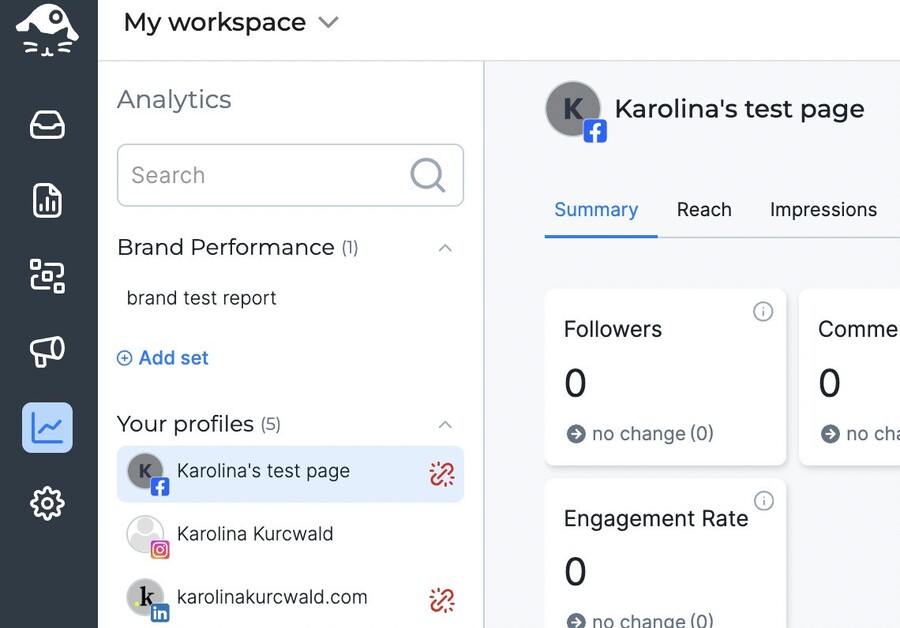
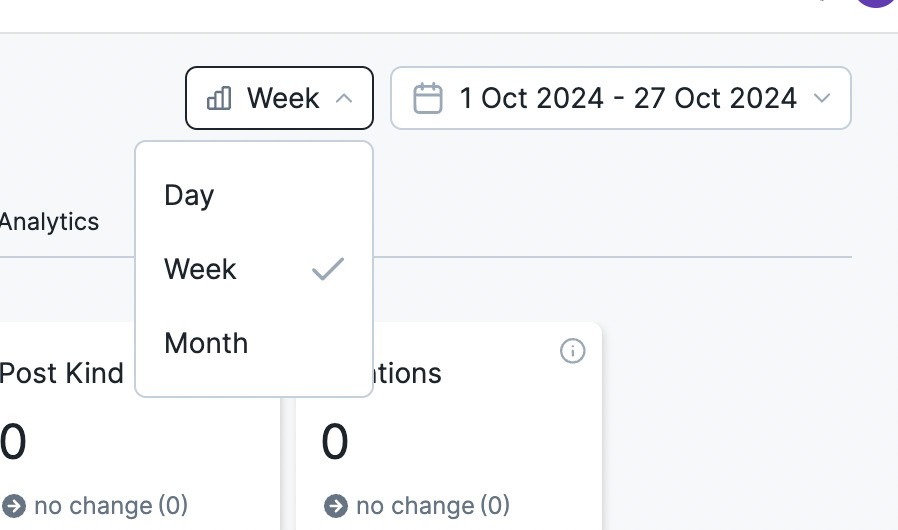
You can view Facebook stats for a Facebook business page you manage or for a page you follow, for example, a competitor’s page, to do some benchmarking. All for a selected time period, including daily, weekly, and monthly.
You can then view the different tabs to see metrics grouped into different categories:
- Reach, with views, active users, follower growth, and a geographical map of your followers’ locations around the world.
- Impressions, with data about impressions coming from organic posts, ads, and viral and non-viral views.
- Engagement, with all the information about reactions, comments, shares, etc., and a breakdown of the share of reactions.
- Content analytics with publishing activity stats, post types, post engagement by the time of day, and top most engaging posts.
- Detailed video stats, including views, autoplay vs. click-to-play views, etc.
- Hashtags used in your content.
- Influencers, i.e., top active users on your Facebook Page.
- And Inbox stats, helping you track messages by tags and sentiment.
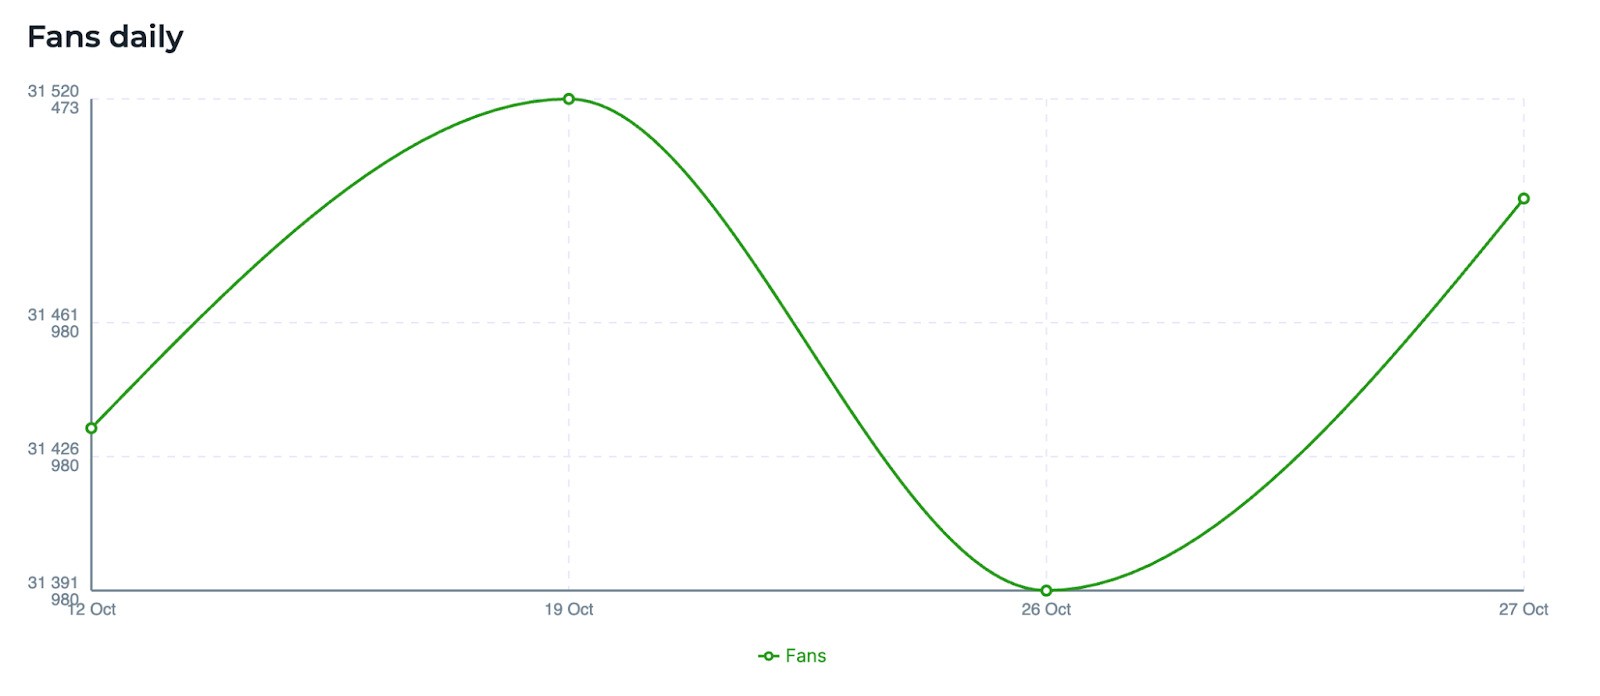
With each metric, you’ll get detailed numbers and graphs you can download.
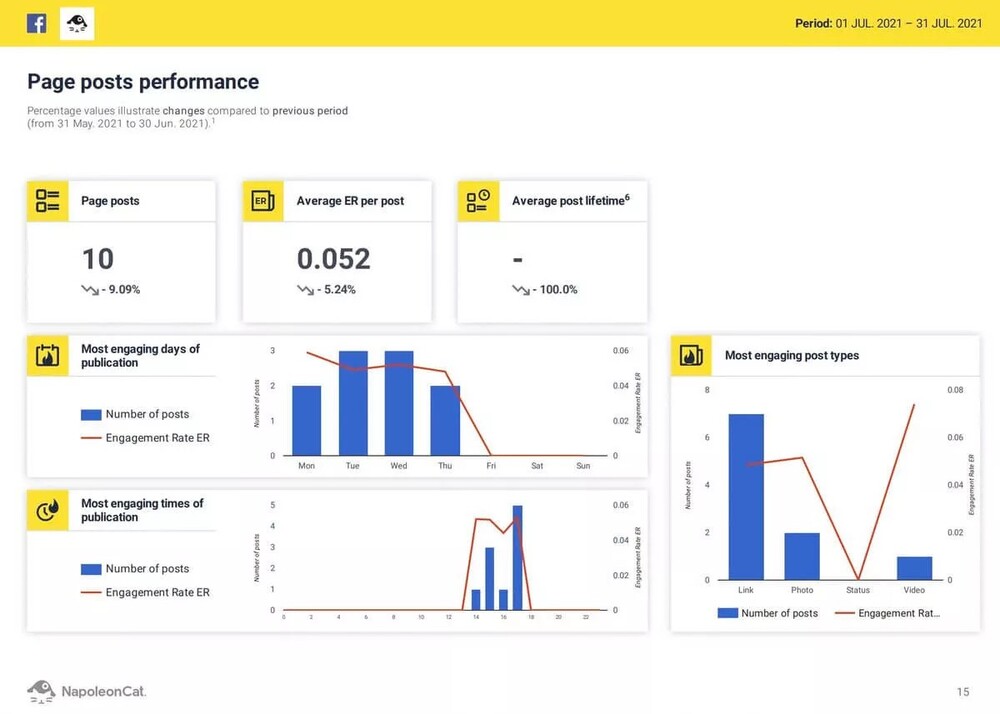
And you can generate or schedule automated Facebook reports in PDFs to share with your clients, coworkers, and boss so they can track the most important Facebook analytics, too.

In-depth Facebook Analytics Tool
Analyze your own pages and track your competitors. Generate in-depth Facebook reports in second (even for multiple Pages at once) – with an all-in-one social media tool.
Expert tips for getting the most from Facebook analytics
Beware of vanity metrics
Yes, it’s tempting to show off great follower growth, but make sure there are actual benefits for the business behind it. It’s easy to get stuck in metrics that just look cool but doesn’t mean much in terms of business outcomes, so make sure that’s not the case for you.
Match your metrics to your business goals
Depending on your marketing strategy, current campaigns, and even the stage of your business, the key metrics you’ll focus on the most might keep changing. Double down on the currently relevant metrics first to fully understand how your strategy is working out.
Always consider the context of the business
Social media marketing is just a part of a bigger business puzzle. That’s why looking at the numbers in isolation will not show you the full picture. Collaborate with other departments like sales, SEO, data analytics, etc. to really show the impact your work on Facebook has on overall business results.
Report regularly
Reporting might not be your favorite thing to do, but checking and comparing results is the only way to consistently progress and improve over time. Luckily, with tools like NapoleonCat’s reports, this is really easy to do. (And you can even schedule automated Facebook reports to get sent to the right people without lifting a finger.)
Best Facebook analytics tools to consider in 2025
NapoleonCat
A Facebook analytics tool accompanied by analytics for other social media platforms like LinkedIn and Instagram, plus a suite of other social media management tools for comment moderation, auto-moderation, content publishing, and social media reports.
Meta Business Suite
If for some reason, you don’t want to use external Facebook management tools for business, Meta Business Suite will give you enough data on your Facebook business pages to still get a good picture of what’s working and what’s not.
Facebook page insights
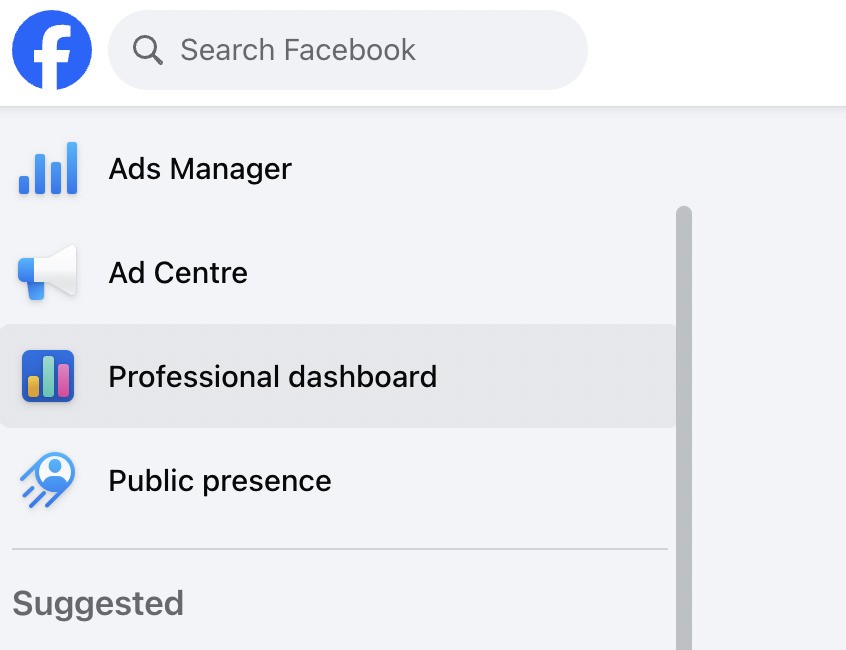
A simple tool available from your Facebook business page. You’ll find it in the left-hand menu under “Professional dashboard”.
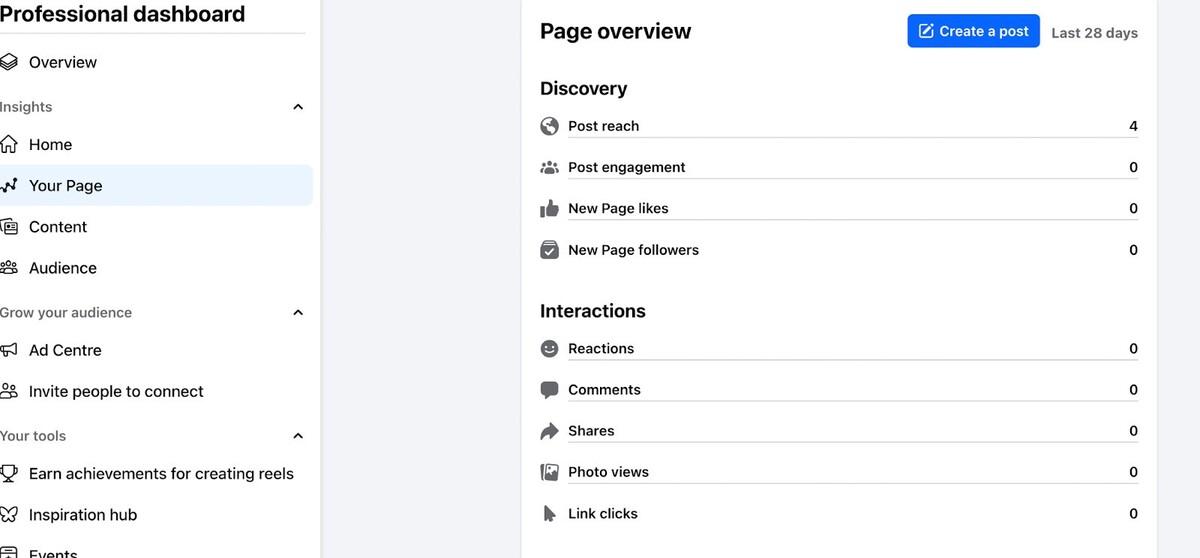
It’s a convenient (though limited) tool for a quick check of your page’s and content’s performance over the last month:
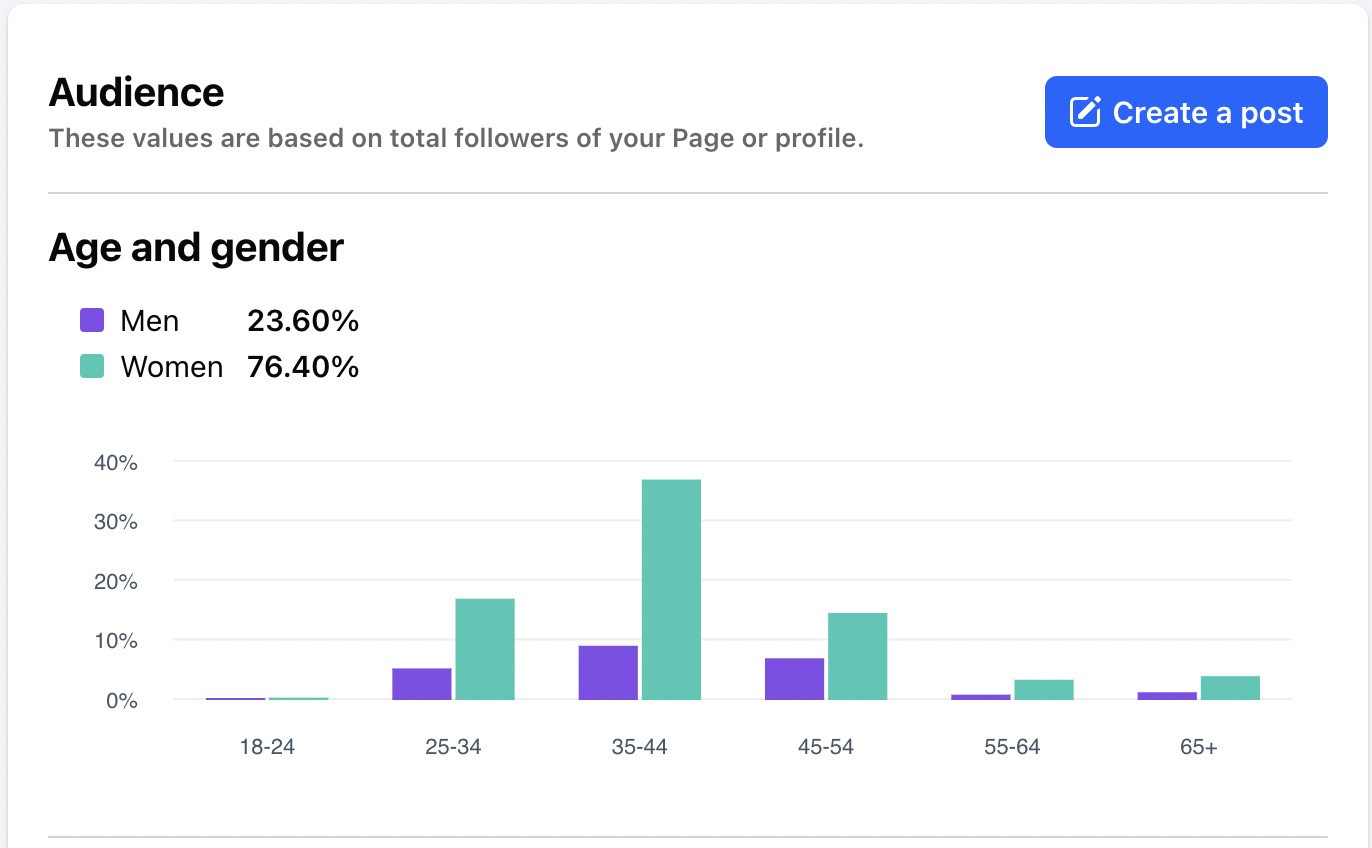
And it has some easily accessible audience insights, too.
What Facebook analytics tool to choose?
Of course, I’m not even close to giving you a full list of all the available Facebook analytics tools for 2025, because this would have to be a very long article. So, treat it as an intro to Facebook analytics software, and click around the tools you have available.
The Meta Business suite and page insights are free tools (with some limitations, though.)
And if you want to see what NapoleonCat’s Facebook analytics tool can do, you can try it out completely for free for 14 days here.

In-depth Facebook Analytics Tool
Analyze your own pages and track your competitors. Generate in-depth Facebook reports in second (even for multiple Pages at once) – with an all-in-one social media tool.
You may also like:
- Your Guide to TikTok Analytics
- Creating Facebook and Instagram Analytics Reports: A Guide
- How to Create a Facebook Analytics Report (in under 1 minute)
- How to Create an Instagram Analytics Report
- 17 Free and Paid Social Media Analytics Tools for Teams
- What Is Facebook Reach and How Is It Calculated?
- How to Track Competitors on Facebook
- Here’s the Best Time to Post on Facebook


