Table of Contents
- Why presenting social media data to clients is essential
- Key metrics to include in your social media reports
- Automate your social media reports with NapoleonCat
- Customizing reports for each client: tailoring data to their needs
- How to use NapoleonCat’s reports feature for effective client communication
- Real-time analytics: Empower your clients with live data access
- Best practices for presenting social media data to clients
- Don’t make social media reports harder than they need to be – for yourself or your clients
Presenting data to clients is a skill of its own. You can send a client a spreadsheet based on a social media reporting template you once created and be done with it – but that’s certainly not how you’ll impress them.
If you’re wondering how to present social media data to clients to make the process smooth and simple while looking like a pro (that you are), here are some tips and social media reporting tools you should definitely consider.
- Why presenting social media data to clients is essential
- Key metrics to include in your social media reports
- Automate your social media reports with NapoleonCat
- Customizing reports for each client: tailoring data to their needs
- How to use NapoleonCat’s reports feature for effective client communication
- Real-time analytics: Empower your clients with live data access
- Best practices for presenting social media data to clients
- Don’t make social media reports harder than they need to be – for yourself or your clients

Schedule automatic social media reports
Showcase your results with comprehensive social media reports. Automate report delivery to keep your team, clients, and stakeholders in the loop. Make data-informed adjustments to your strategy – with an all-in-one social media tool.
Why presenting social media data to clients is essential
If you’re a social media manager or a marketer, whether you work for an agency or are a social media freelancer, I probably don’t have to tell you that impressions are super important when you work with clients.
Of course, what you do for them matters most – the results, the engagement, and all the benefits that working with you make it worth investing their budgets. But how you present this data is also an important part of the overall message you get across. Because data presentation:
- can highlight your wins for more impact or obscure them, making them hard to find
- helps clients make sense of the data in the first place (or makes it harder to do it)
- helps draw their attention where you want it to be (or gets it scattered all over the place)
- and helps make you look professional, reliable, and like you know what you’re talking about (and believe me, that’s not always the case for everyone.)
That’s why creating a transparent, visually appealing social media report in a .PDF file with graphs and charts will almost always make a better impression than a bare .XLS file (or worse, a .CSV 😱).
And I’ll show you how to do that easily, even when you’re not a graphic designer and Excel master all in one.
Key metrics to include in your social media reports
Let’s start with what’s inside, though, before we talk about how to present social media data to clients.
The metrics you’ll eventually include in your social media reports will depend on several factors, including:
- the social media platforms
- and your client’s specific goals.
But there are some general ones almost every social media report will include:
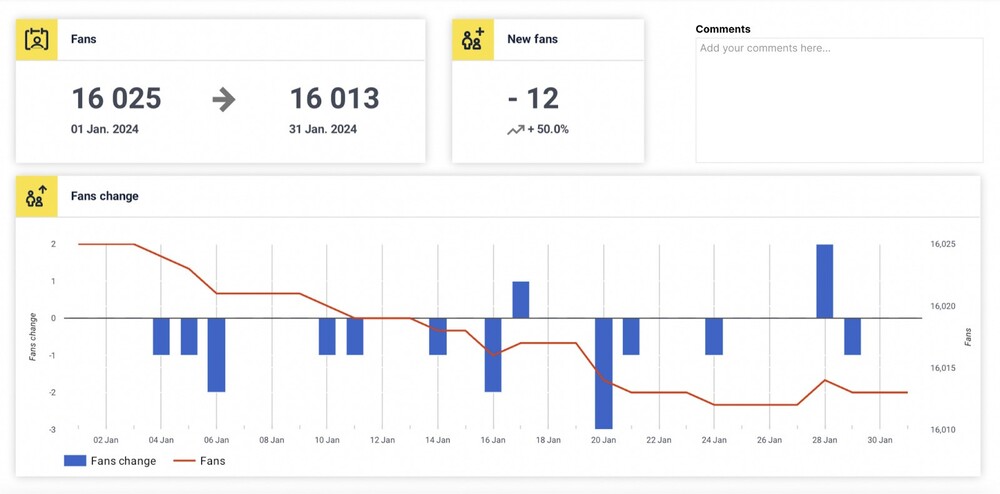
- Follower growth: how your clients’ audience size on different social media accounts keeps changing over time.
- Engagement rate: How your followers interact and engage with your content, calculated depending on the social media channels, including things like likes, shares, comments, etc.
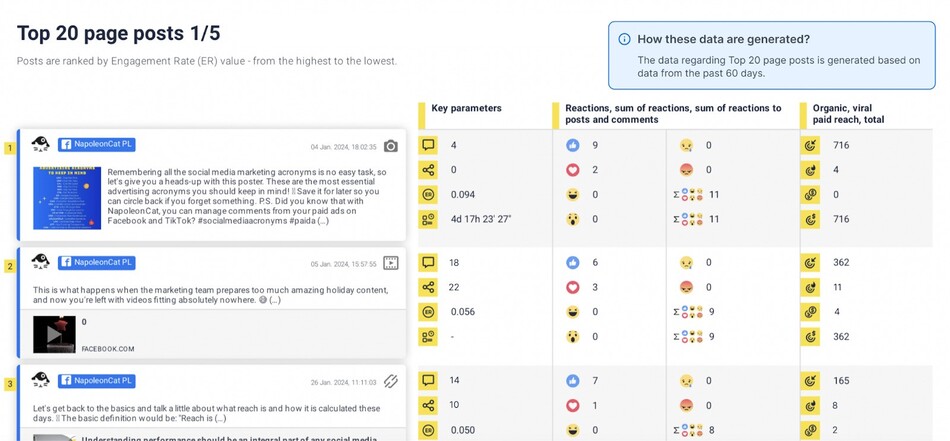
- Individual post performance: This gives insight into top-performing posts and the type of content, topics and publishing times that are most effective at getting your audience engaged.
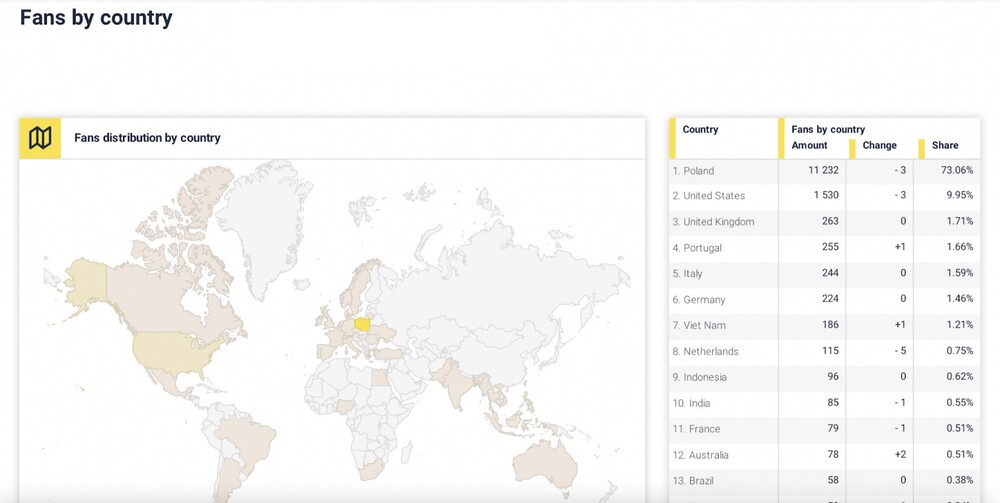
- Audience insights: Including demographics and audience activity to understand your followers better, including when they’re the most active, so that you can align your content strategy for peak performance.
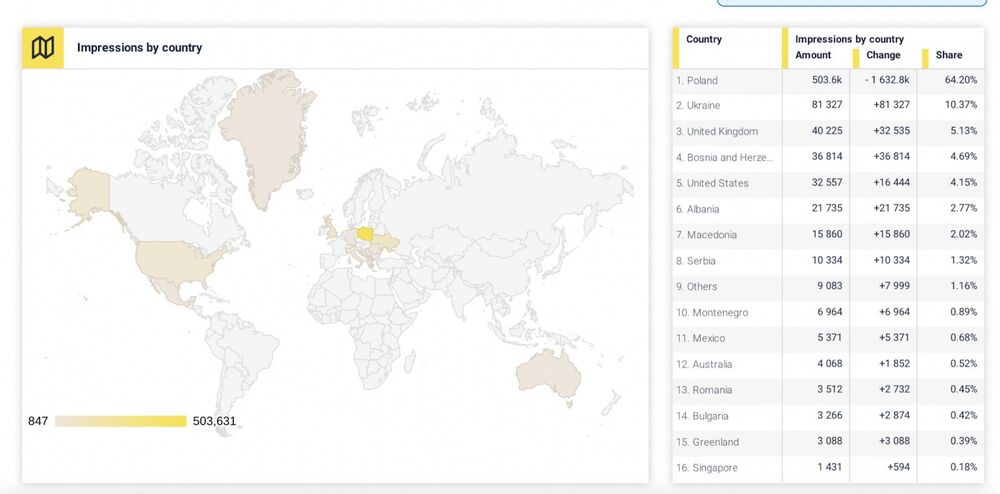
- Reach: Explaining how your content performs in terms of views and impressions, including details about location, timing, etc.
- Response rates: To show your clients how effective your comment moderation is on selected social media platforms.
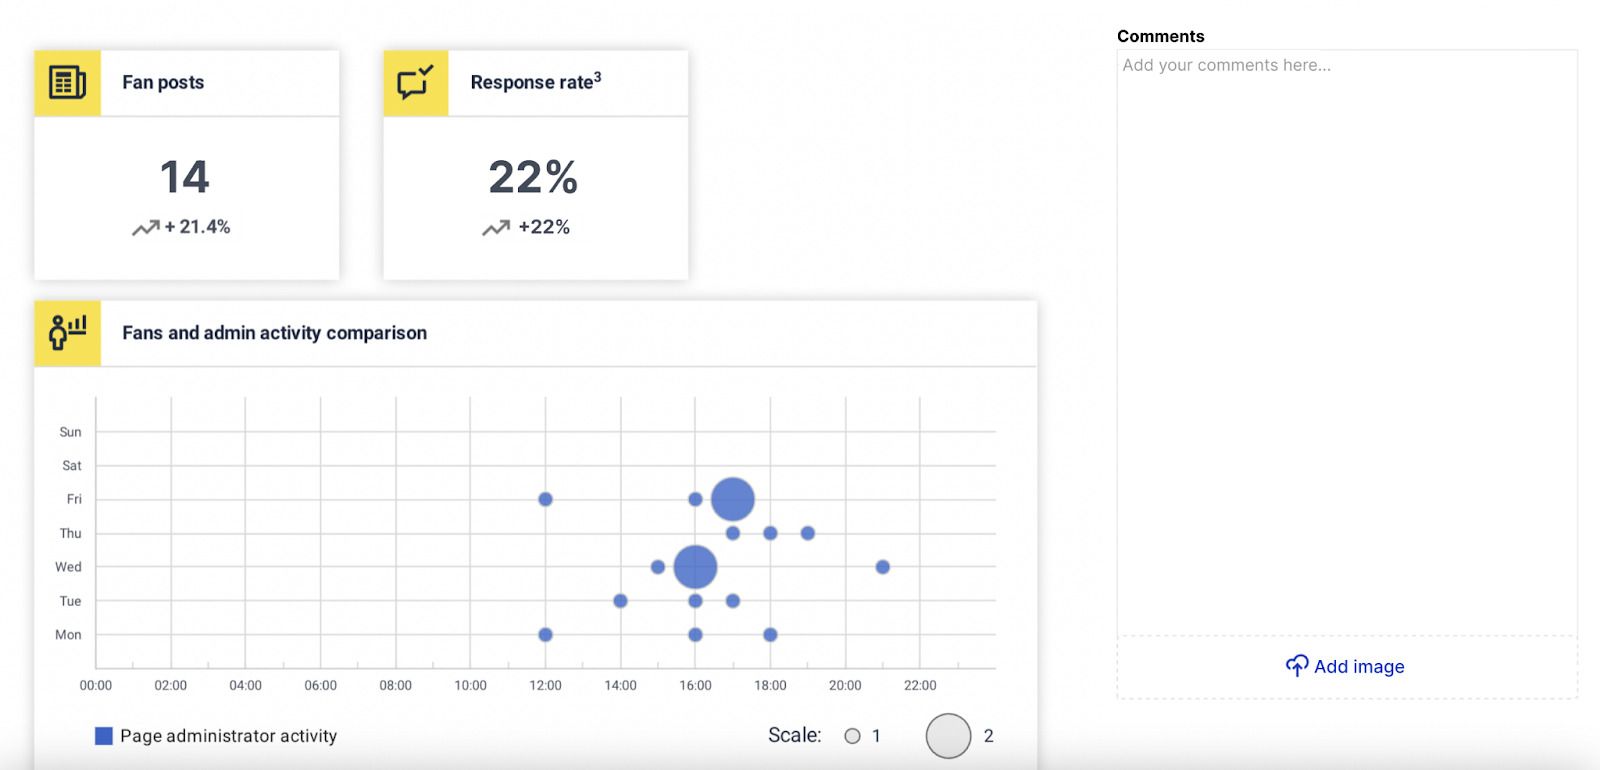
- Competitor benchmarks: How your clients’ performance compares to key competitors in their space.
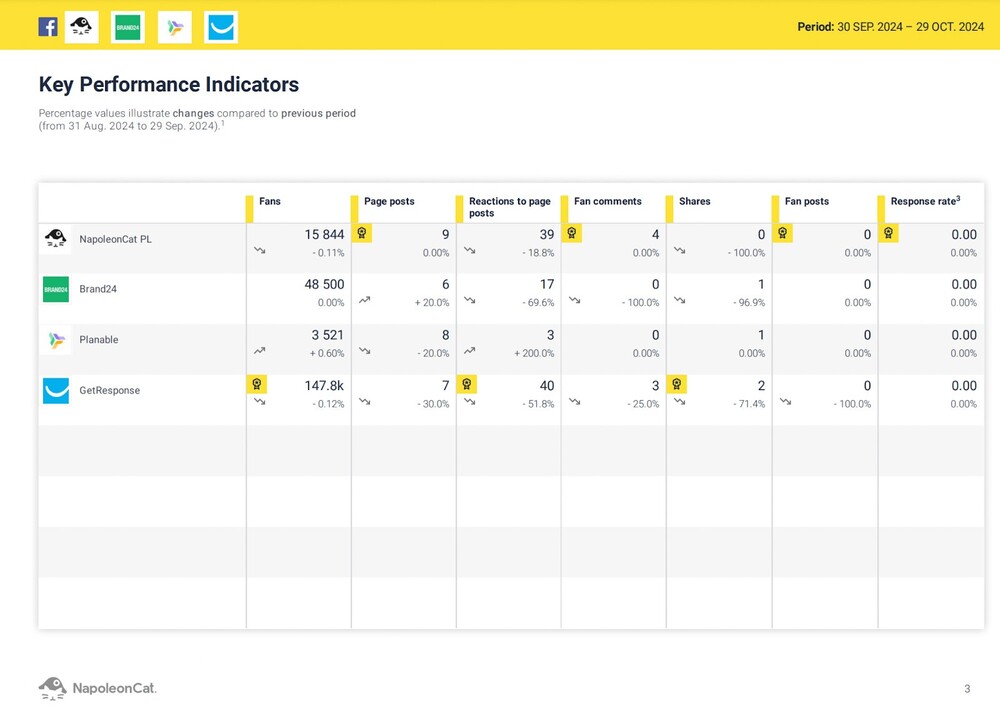
Automate your social media reports with NapoleonCat
Creating different types of social media reports, especially for multiple social media platforms or competitive analysis reports, will require some manual work, even if it’s just copying and pasting stuff into your social media reporting template.
Unless you automate it. (ba-dum-tss 🥁)
You can do that, for example, by using NapoleonCat and its Reports feature, which lets you easily create PDF reports with social media analytics.
- Connect your client’s social media profile(s) to NapoleonCat. You can connect your own accounts (i.e., your clients’ accounts) and any public competitor account for comparison.
- In the Reports tab, select the period for the report.
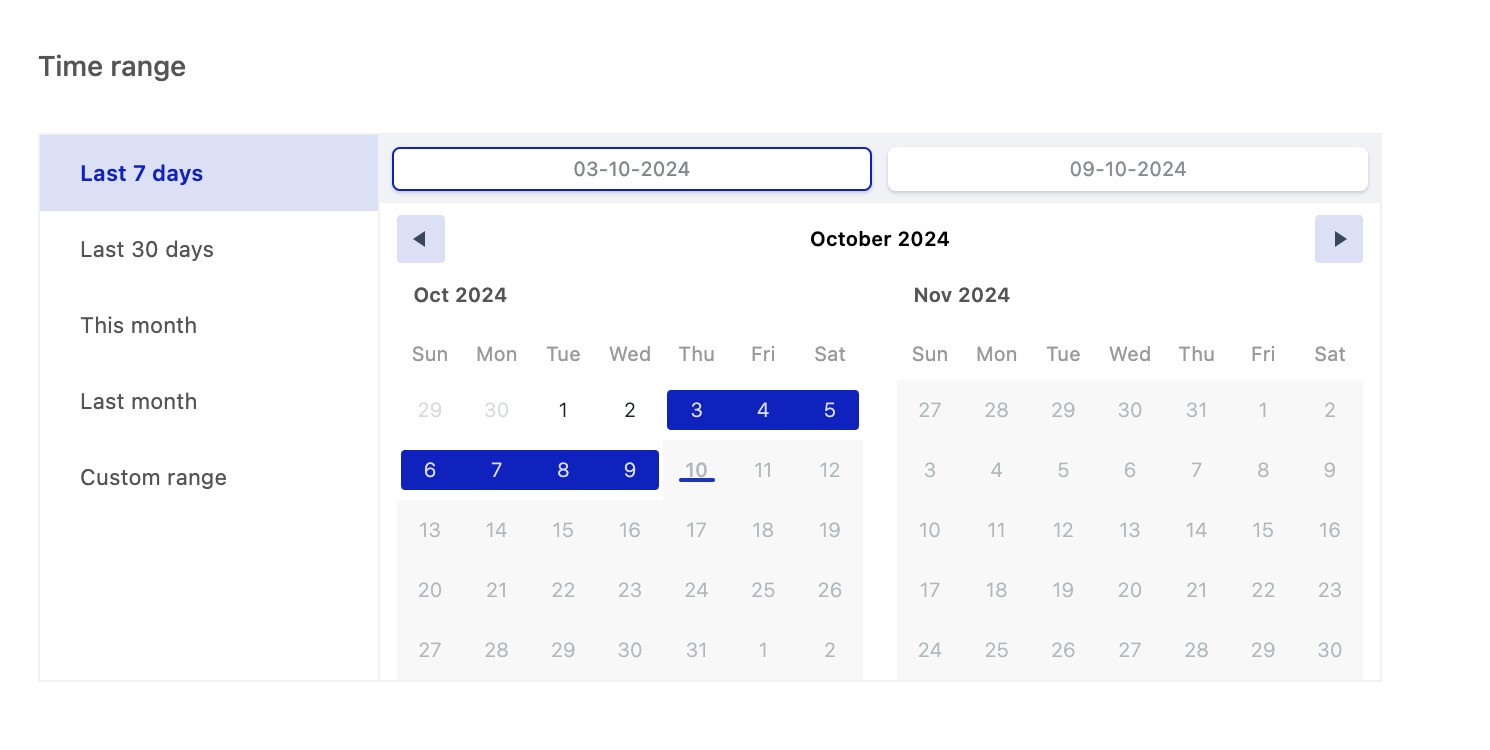
- Add your logo or your client’s logo to personalize the report and make an even better impression on your clients.
- Pick the metrics you want the report to include from the platform-specific lists.
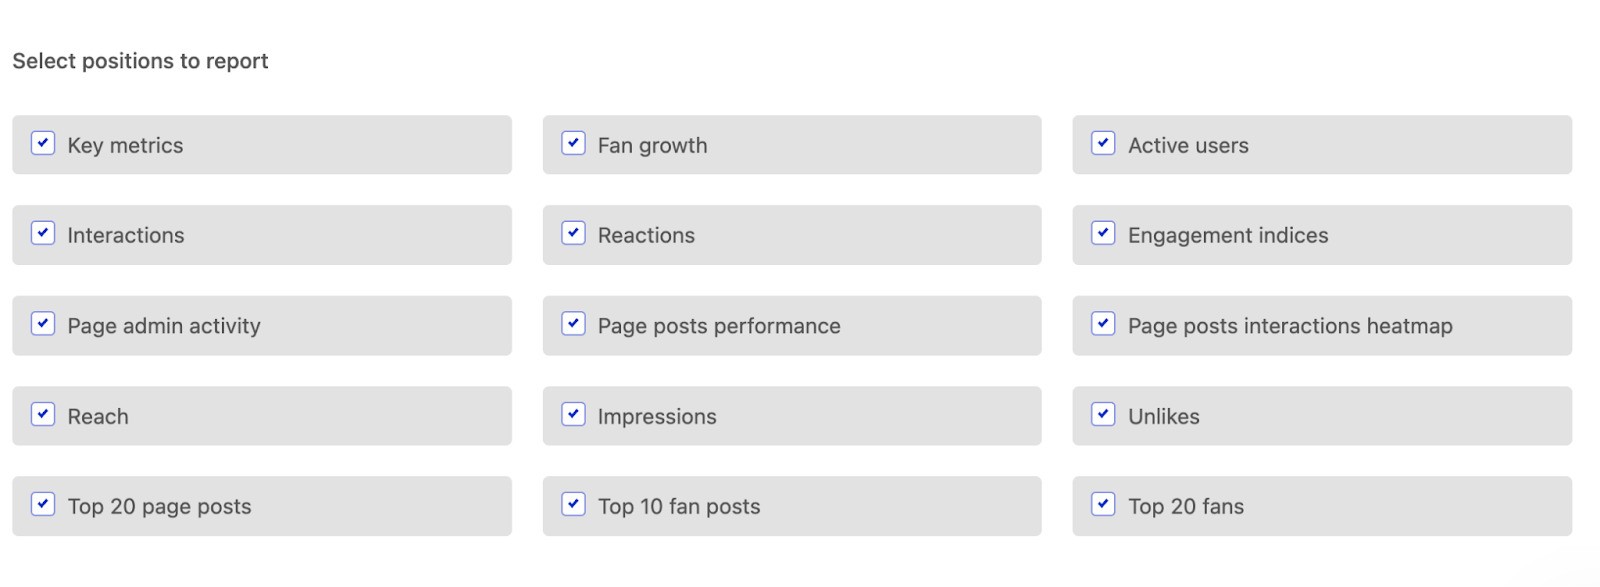
- And generate the report with just one click.
You can generate individual reports or schedule a regular report to send out every week, month, or quarter automatically to selected email addresses. This way, you don’t even have to click that one button anymore, and can still impress your clients with timely social media reports that look super professional.

Schedule automatic social media reports
Showcase your results with comprehensive social media reports. Automate report delivery to keep your team, clients, and stakeholders in the loop. Make data-informed adjustments to your strategy – with an all-in-one social media tool.
Customizing reports for each client: tailoring data to their needs
Automating your social media reports doesn’t mean everyone gets the same thing. With NapoleonCat, you can tailor the contents of your social media report in a way that fits their individual needs.
- Adjust the time range for the report – from past week to quarter to a year and more. NapoleonCat lets you look back on past performance much more flexibly than some of the social media platforms.
- Pick the metrics to include in your social media reporting. You’ll have different metrics to choose from depending on the social media platform, and whether you’re creating a social media report for accounts your clients manage vs. competitor accounts they follow. In either case, you can select only the ones that matter – for example, for a particular social media campaign or for the company’s specific strategic marketing goals, like, for example, brand awareness or lead generation.
- If you want a periodic report, you can schedule an automated weekly, monthly, or quarterly report. You can also edit the contents in between sends if you need to add additional metrics or remove the ones that are no longer relevant.
How to use NapoleonCat’s reports feature for effective client communication
Now, if you’re wondering how to present social media data to clients more effectively, NapoleonCat’s features will also prove helpful.
You can use the report generated in NapoleonCat in several different ways:
- Send the report as a PDF file attached to an email.
- Schedule the email to get sent every week, month or quarter, automatically.
- And you can also present the report in an online meeting to talk about the different metrics and charts in more detail.
- You could also record a presentation in a tool like Loom, for example, to review the different pages, charts, and results and provide commentary.
None of these require extensive preparation, engaging your design team or even your analytics team. Or creating numerous slide decks, which I’m sure you and your team will be relieved by.
You can also add your comments and your own images to the different data points and charts so that a live presentation might not even be necessary (unless your client really wants you to relay the conclusions in person). And everyone might be happy preventing another meeting that could’ve been an email.
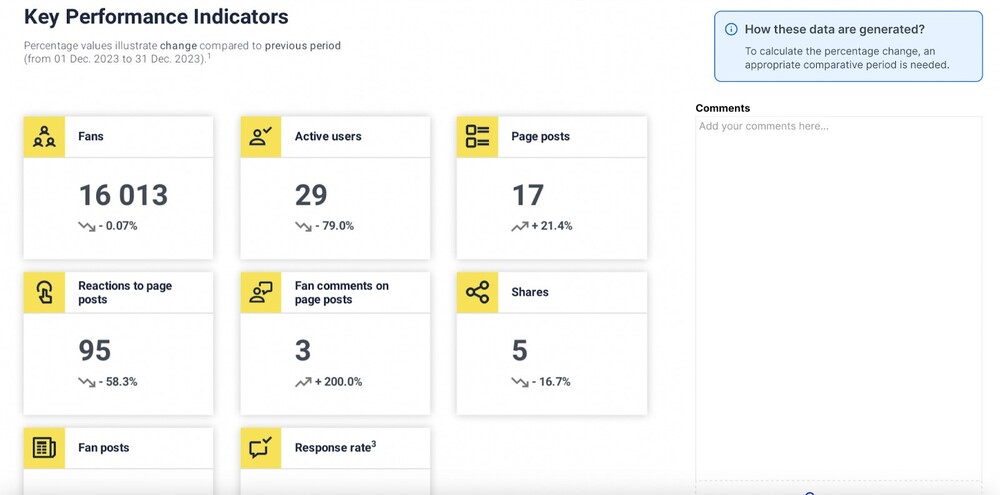
Depending on the data it includes, a report will also highlight change over time, which makes interpreting the data a piece of cake for anyone, visually supported by clear graphs and charts.
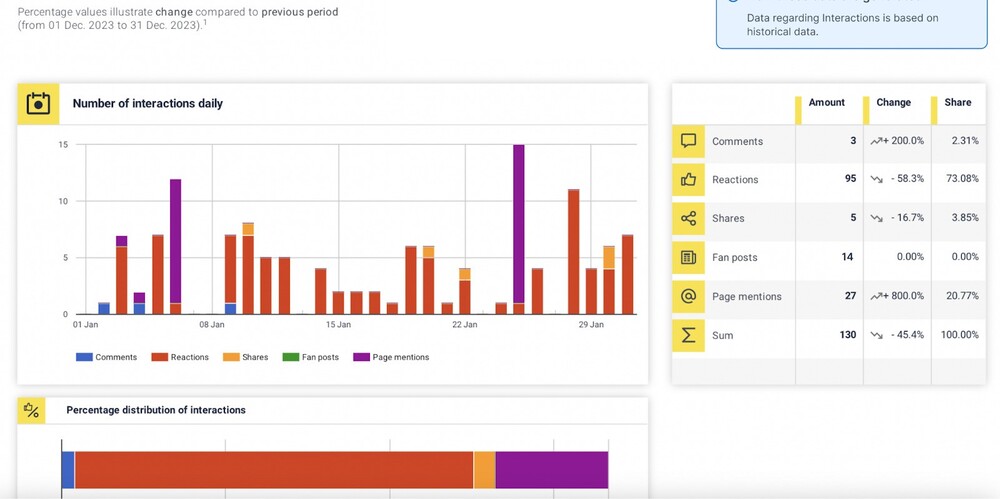
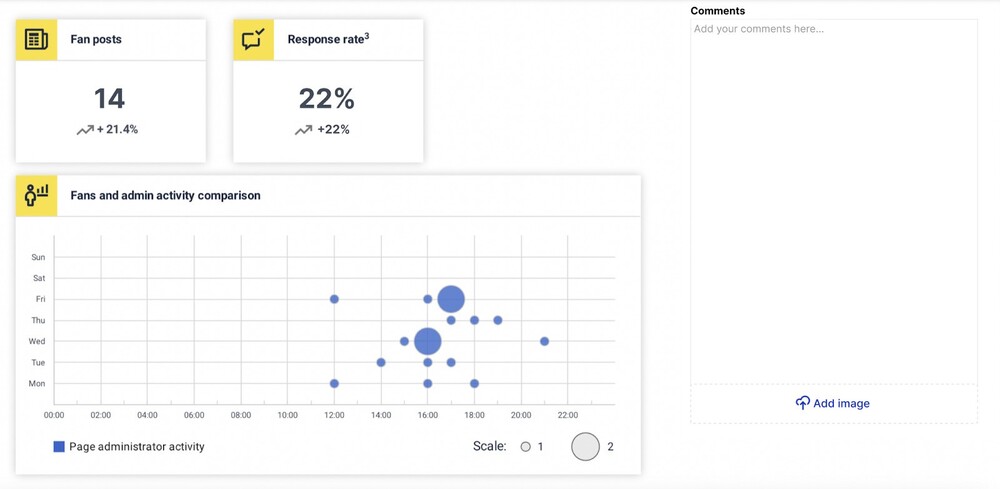
A NapoleonCat social media report will also make it really easy to compare different data points and present them in a way that leaves no doubt as to what’s going on.
Real-time analytics: Empower your clients with live data access
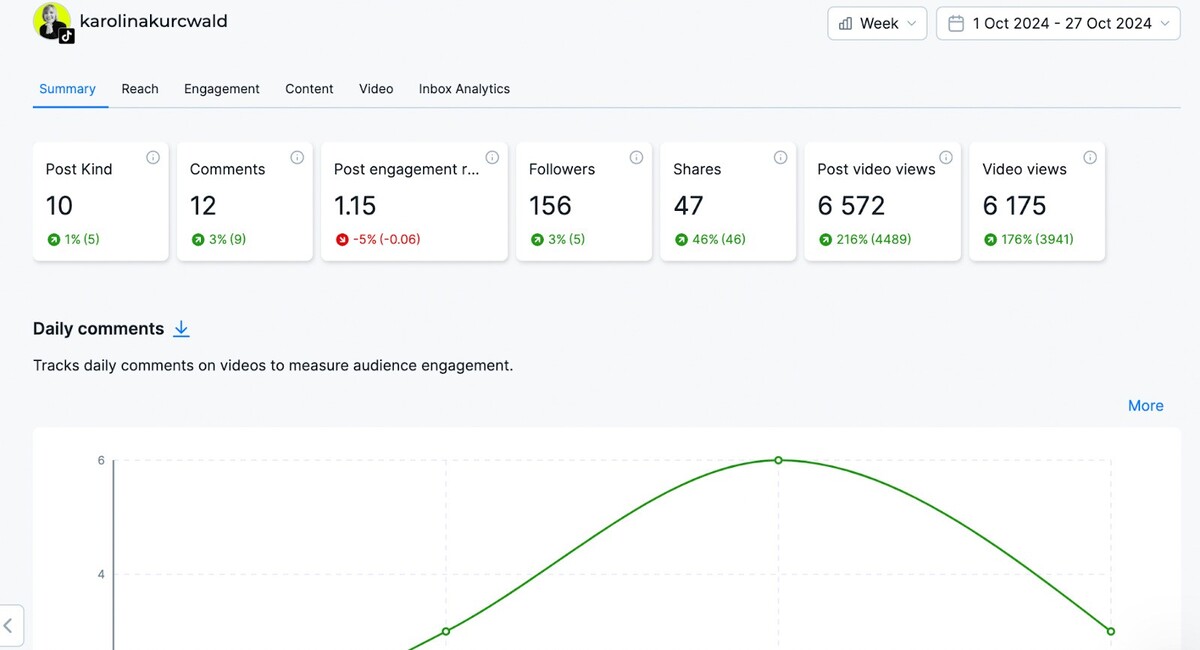
Apart from sending your clients a social media report to go through, you can also give them access to real-time analytics dashboards available in NapoleonCat, so that they can check what’s going on whenever they need, without having to wait for you to send the report over.
NapoleonCat includes a detailed analytics module where you can:
- View performance and audience details for different social media platforms, including your competitor accounts
- See a breakdown of your Social Inbox interactions by tag and sentiment
- Download the graphs and charts as .PNG files, so that you can include them in email communications or in presentations around a specific metric or topic.
How to set up viewing access levels for clients in NapoleonCat
When you use NapoleonCat to work with your clients on their social media comms, you can grant them access to the different modules for their social media channels, for example, to approve social media posts or track analytics numbers. This happens in individual workspaces you can set up for each of your clients and the team that works on their accounts.
To let them view analytics on their own, go to their workspace settings and select Members in the menu on the left.
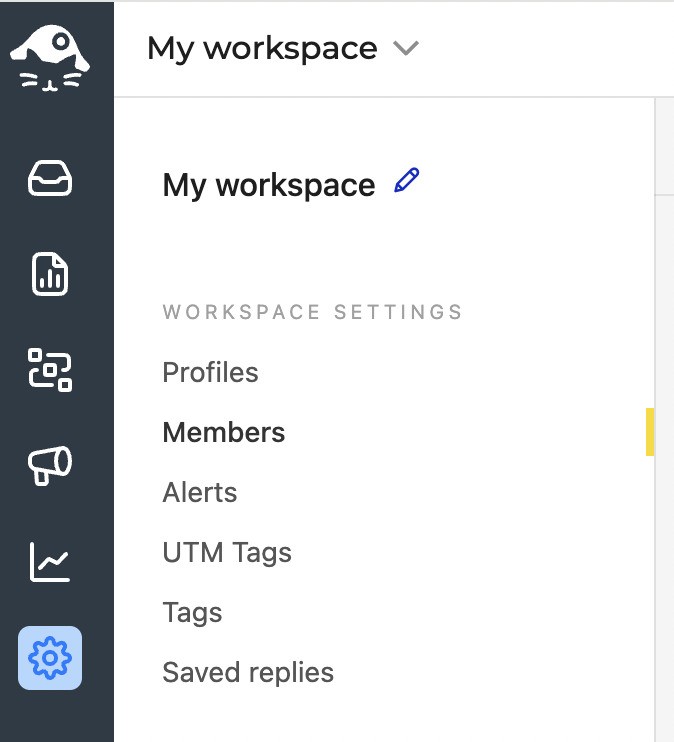
Then, add a new member and select the levels of access to the different features of the NapoleonCat platform. For each, you can grant viewing or editing access, which will let them change things and perform actions in NapoleonCat.

For viewing access to Analytics only, select “View” in the dropdown under Analytics. You can add several people on your client’s team, if necessary.
Best practices for presenting social media data to clients
I started with explaining why how you present social media data to your clients matters – and let me end on the same note with a handful of tips and best practices.
- Highlight what’s important. Nobody wants to spend hours digging into a complicated report to get what they want. So make sure what’s important to your clients comes first and is very clear at first glance.
- Use visuals. Visuals tend to make data easier to understand and compare, and they will certainly make your reports more attractive, so that they don’t end up unread (which probably happens more than you’d think. I have no data to back that statement, though. 😏)
- Make interpreting the data as effortless as possible. Add clear conclusions, explain in words what can’t be visualized, and tie the numbers to the goals you agreed on with your client.
- Don’t overwhelm the client with data. It might be tempting to cram all you can into a report. But that might only confuse the client and obscure the most important numbers you want to highlight. So stick to those.
- Show change over time. Whether that’s a single social media campaign or a long-haul project executing their social media strategy, make sure it’s clear how the numbers change, and what your role is in that change (especially if it’s positive, clearly. 🙂)
Don’t make social media reports harder than they need to be – for yourself or your clients
Impressing your clients with a pro-looking, personalized and relevant social media report is, unlike what some might think, actually easier than sending it all in unintuitive spreadsheets.
That’s when you have the right social media reporting tools that save time while improving the presentation of your data.
So, try NapoleonCat completely for free here, and see what your clients say the first time they get a report. I wish I could be there to see it. 🙂

Schedule automatic social media reports
Showcase your results with comprehensive social media reports. Automate report delivery to keep your team, clients, and stakeholders in the loop. Make data-informed adjustments to your strategy – with an all-in-one social media tool.
You may also like:
- How to Measure Brand Awareness on Social Media
- Meet The Best Social Media Benchmarking Tool
- Competitor Mapping: Why And How To Do It
- Social Media Competitor Analysis – Complete Guide
- How to Track Competitors on Facebook
- How to Analyze Competitors on Instagram
- Top 10 Competitive Intelligence Tools
- Creating Facebook and Instagram Analytics Reports: A Guide
- How to Track Instagram Follower Count Over Time
- How To Find Your Target Audience On Social Media

