Table of Contents
- What does reach mean on Facebook?
- How does Facebook reach work?
- What are the different types of Facebook reach?
- How do you calculate Facebook reach?
- Difference between reach, impressions, and engagement on Facebook
- How to increase your Facebook reach
- How to analyze your Facebook reach
- Don’t forget – reach is not everything
So, what does reach mean on Facebook, how do you calculate it, and – maybe most importantly – how do you improve it? Let’s find out!
- What does reach mean on Facebook?
- How does Facebook reach work?
- What are the different types of Facebook reach?
- How do you calculate Facebook reach?
- Difference between reach, impressions, and engagement on Facebook
- How to increase your Facebook reach
- How to analyze your Facebook reach
- Don’t forget – reach is not everything
Facebook Reach Calculator
In-depth Facebook Analytics. Track your performance and monitor competitors on Facebook. Generate & schedule FB reports for up to 8 Pages at once – with an all-in-one social media tool.
What does reach mean on Facebook?
According to Facebook, reach is the number of unique users who display any content from your Facebook Page or about your Page on their screens. Or, maybe more accurately, the number of unique screens, which technically count as a user. (After all, Facebook is not able to detect whether two people are looking at the same screen. At least yet. 👀)
This is the standard definition of Facebook reach. Simple enough, right?
But that’s where things get a little bit more complicated, because you can generally calculate reach in 1-day, 7-day, and 28-day increments.
For example:
If someone sees your content twice in one day and then twice the next day, and you choose to view reach in 1-day increments, the user will be counted once on day 1 and once on day 2.
If you choose to view 7-day or 28-day reach, the same user will only be counted once in the 7-day and 28-day periods, respectively, regardless of the number of times they see your content.
What does this mean?
The exact same performance when it comes to reaching Facebook users can be represented in a few different ways, depending on the timespan you take into account. Keep this in mind when analyzing your results and reporting them, as they might vary.
How does Facebook reach work?
How Facebook reach works changes with the changes in Facebook’s algorithm. At this point, the algorithm is focused on what Facebook users want to see, and that means the platform is trying to help the right content reach the right audience.
And what “the right audience” means is not just based on audience demographics, but also on their behavior and interactions on the platform, including likes, comments, and replies, which all contribute into the eventual reach of your Facebook content.
What are the different types of Facebook reach?
First of all, when we’re answering the “what does reach mean on Facebook” question, we need to make a distinction between two different types of Facebook reach:
- Facebook post reach, which shows you how many people saw an individual piece of content in their newsfeeds
- Facebook page reach, which shows the general number of users who saw any kind of content from your Facebook page.
But that’s just for starters.
Regardless of the Facebook post vs. Facebook Page distinction, you can also measure:
- Facebook organic reach, which is how your content reaches your audience without any boosts. It relies on the algorithm and audience engagement.
- Facebook paid reach, which is the reach your content gets when you pay for it to reach more people. You can increase it by increasing your ad budget and/or optimizing advertising campaign settings.
- Facebook viral reach, which is the reach that is induced by your content but goes beyond your intended audience. For example, someone sees their Facebook connection has liked a piece of content. This is how posts go viral.
And what about total reach, then?
This is what Facebook page total reach can look like. Organic reach can be broken down into viral and non-viral (the latter would be the “standard” organic reach.)
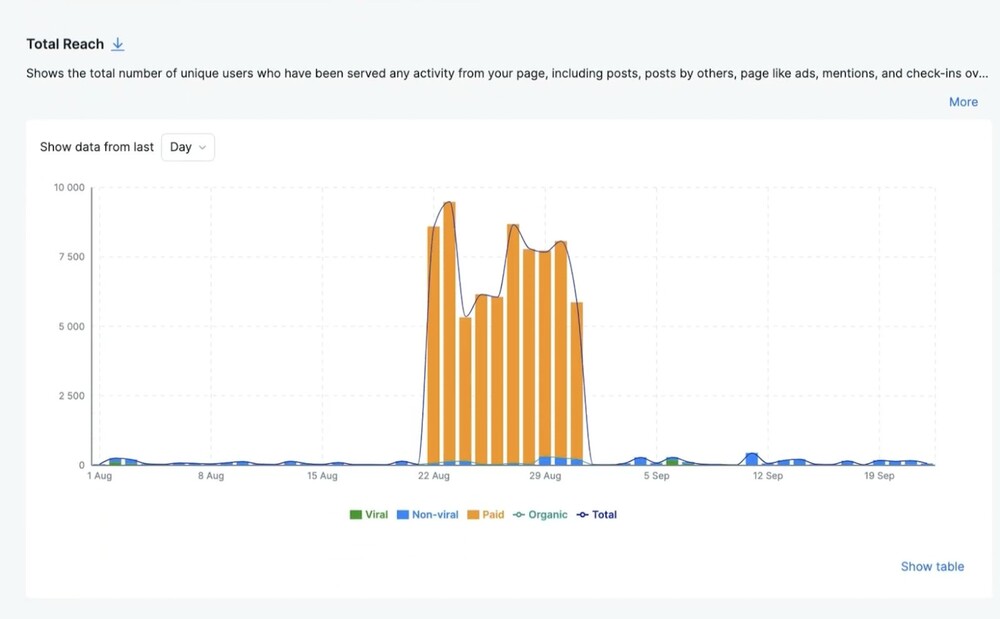
From the graph above, it’s also pretty clear that these days, Facebook reach heavily relies on advertising spend and sponsored posts.
Total reach is another way to call the reach of a Page or an individual piece of content in a certain timeframe that includes the different types of reach: organic, paid, and viral. It only makes sense when you view in the context of the 1-, 7-, and 28-day timeframes defined by Facebook.
Again, total reach is not a sum. For example, when analyzing reach in 7-day increments, a user may have seen your content 2 times in one week, and 2 times in the second week. In both cases, it’s 1 user per week. And you can’t add them up between the weeks, since the sum will no longer convey unique people for any of the predefined timeframes.
Create Facebook analytics reports within seconds
Generate custom Facebook Page reports within seconds. Schedule automatic reports, analyze your competitors, include up to 8 FB Pages in one report, and more – with an all-in-one social media tool.
How do you calculate Facebook reach?
First of all, you don’t have to calculate it yourself, because both Facebook insights and external Facebook management tools for business that include Facebook analytics will do it for you automatically.
But in a nutshell, to calculate your average page reach, you divide the average number of users reached per post by the number of total page likes.
Again, average is key here because of the time intervals Facebook uses to measure unique users.
Difference between reach, impressions, and engagement on Facebook
Before we talk about boosting your Facebook reach, let’s clear one more thing: reach, impressions, and engagement are different metrics representing different KPIs. Here’s a quick breakdown:
- Reach – as you already know – measures how many unique people saw your content across a time period.
- Impressions show the number of overall views on a single piece of content – so we’ll count multiple views by one user. This also means impressions will always be higher than reach.
- Engagement shows how Facebook users interact with your content, including comments, shares, likes, and other interactions.
And which one should you measure?
The usual answer is: all of them. Of course, depending on your strategic goals, one might be currently more important than the other.
For example, increasing reach is important for your content to find more and more people. On the other hand, focusing on reach alone might get you nowhere – because reach without engagement won’t bring you conversions or sales, if that’s what you’re after. It might help with brand awareness, though – so, as you can see, a lot depends on your current Facebook marketing strategy and its focus.
How to increase your Facebook reach
Even though the algorithm is chiefly responsible for how your content does on Facebook (and in general, organic reach is, let’s say, not great) you have several options to influence it and boost the reach of your Facebook content. Here are a few of them.
1. Be consistent
I know, easier said than done. But consistency is definitely one of the top priorities for widening your reach and your Facebook presence.
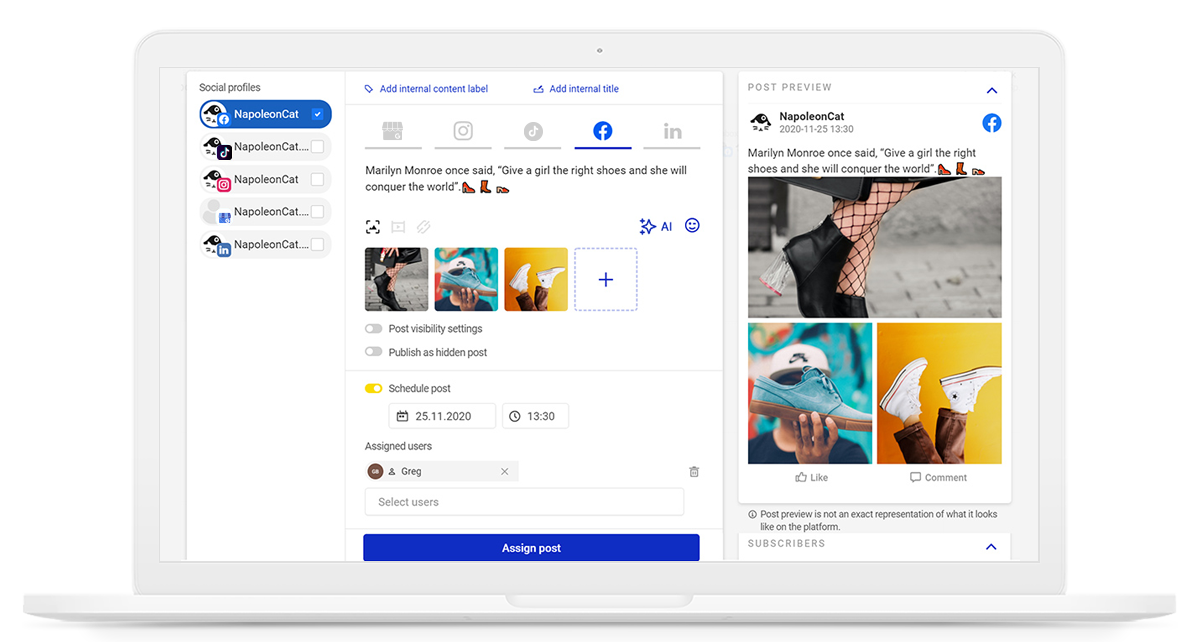
And what definitely helps with consistency is scheduling your content in advance – for example, with NapoleonCat’s Publisher. You can use it to schedule Facebook post, reels, and stories – for multiple FB Pages at once.
2. Watch your timing
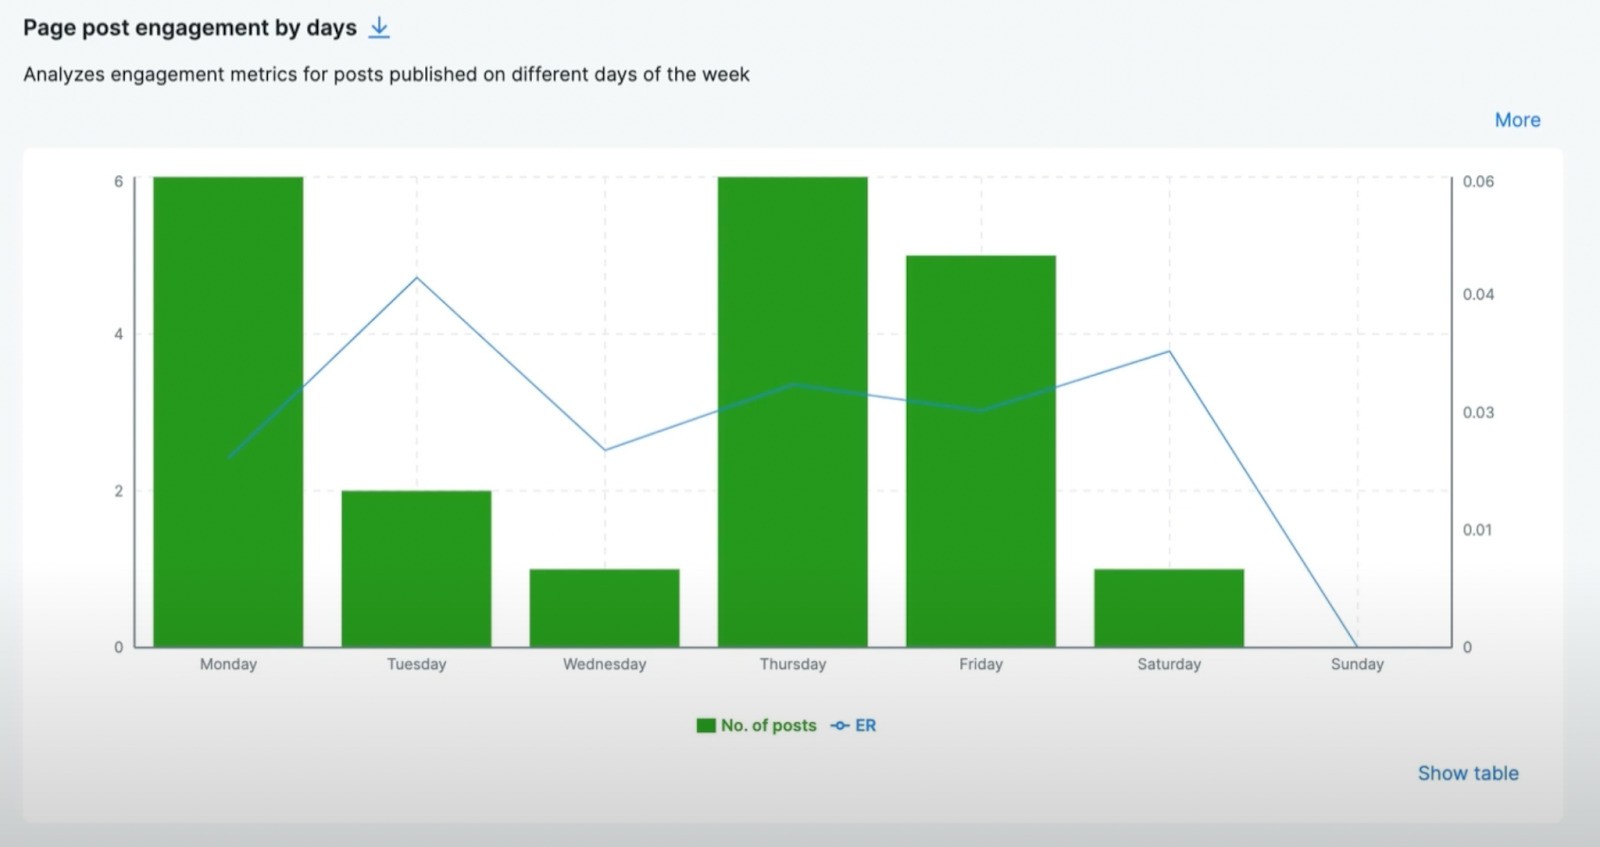
Timing is important mainly for your organic reach. If your posts make it to people’s feeds when they’re actively scrolling Facebook, you obviously have greater chances for reaching as many people as possible.
So follow your audience insights (when they’re most active) and engagement metrics (when your posts get the most engagement) to see when it’s best to post your content – you can use a Facebook analytics tool like NapoleonCat to do that.
3. Optimize your content for the algorithm
And what I mean by optimizing is taking greater care of your content on Facebook in general rather than only reposting whatever you just put on LinkedIn or Instagram without putting much thought into it. (No wonder it’s not reaching many people.)
Here are some things you can do:
- Create an individual plan for your Facebook content.
- Each piece of content should have a goal. Do you want people to comment, click a link, or share the piece with your friends? Always create your posts with their goals in mind.
- Add a CTA to the post to encourage engagement.
- If you repurpose content from other platforms, add a unique caption to it.
- Pay attention to your captions in general – make them engaging and not just a link without a commentary.
4. Pay for some of your reach
The obvious way to expand your reach beyond your current audience is to advertise on Facebook. That way, you can also build your fan base and potentially have more organic reach in the future. (Potentially because more followers don’t automatically mean more reach for your organic content, I’m afraid – that’s a common misconception.)
Regularly boosting your content can definitely increase your visibility on Facebook, though.
5. Keep track of your results
To know exactly what to do and when to do it to increase both reach and engagement, (instead of throwing the proverbial spaghetti at the wall), keep an eye on your Facebook analytics. And do it regularly to have a clear picture of how your content is doing.
Especially given how Facebook reach is calculated and how misleading a one-off look at the numbers can sometimes be.
How to analyze your Facebook reach
Let me show you how to do that with NapoleonCat’s Facebook analytics tool. You’ll first need to connect your Facebook Page to NapoleonCat. You can also connect other Facebook pages you want to analyze – for example, pages of your competitors. You’ll be able to track detailed metrics and compare them with your performance.
When you go to the Analytics tab and select your Facebook page, you’ll see several tabs. To analyze reach, select (drumroll, please) Reach.
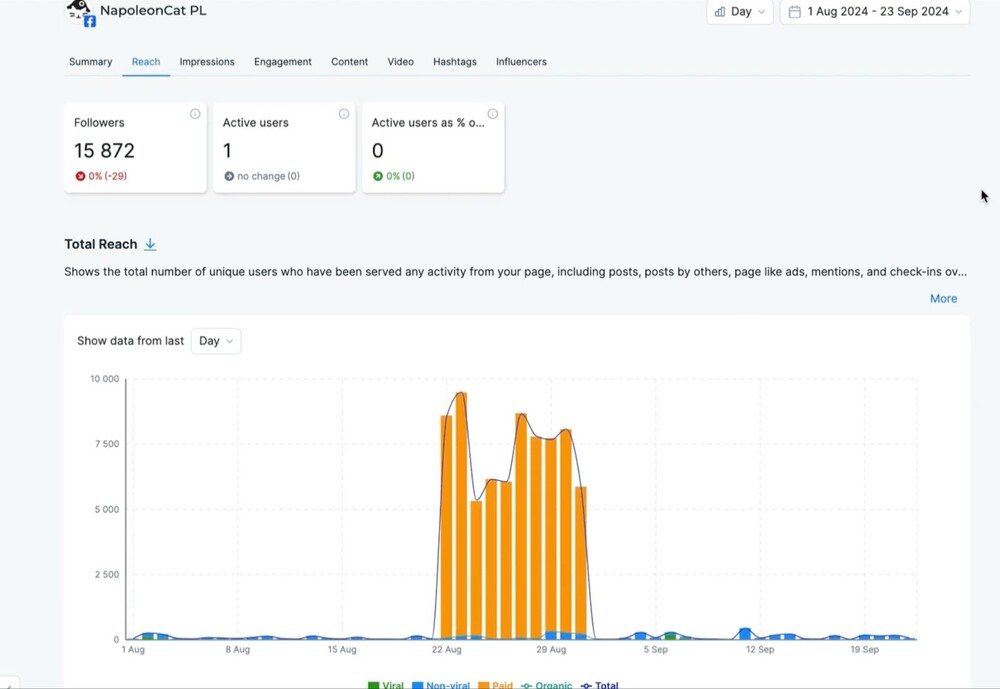
You’ll see the number of people who follow your page and will be able to look at different aspects of your Facebook reach for the last day, week, and 28 days. You now know what to do with it. 😎
Apart from your total reach, you’ll also see charts showing the following metrics:
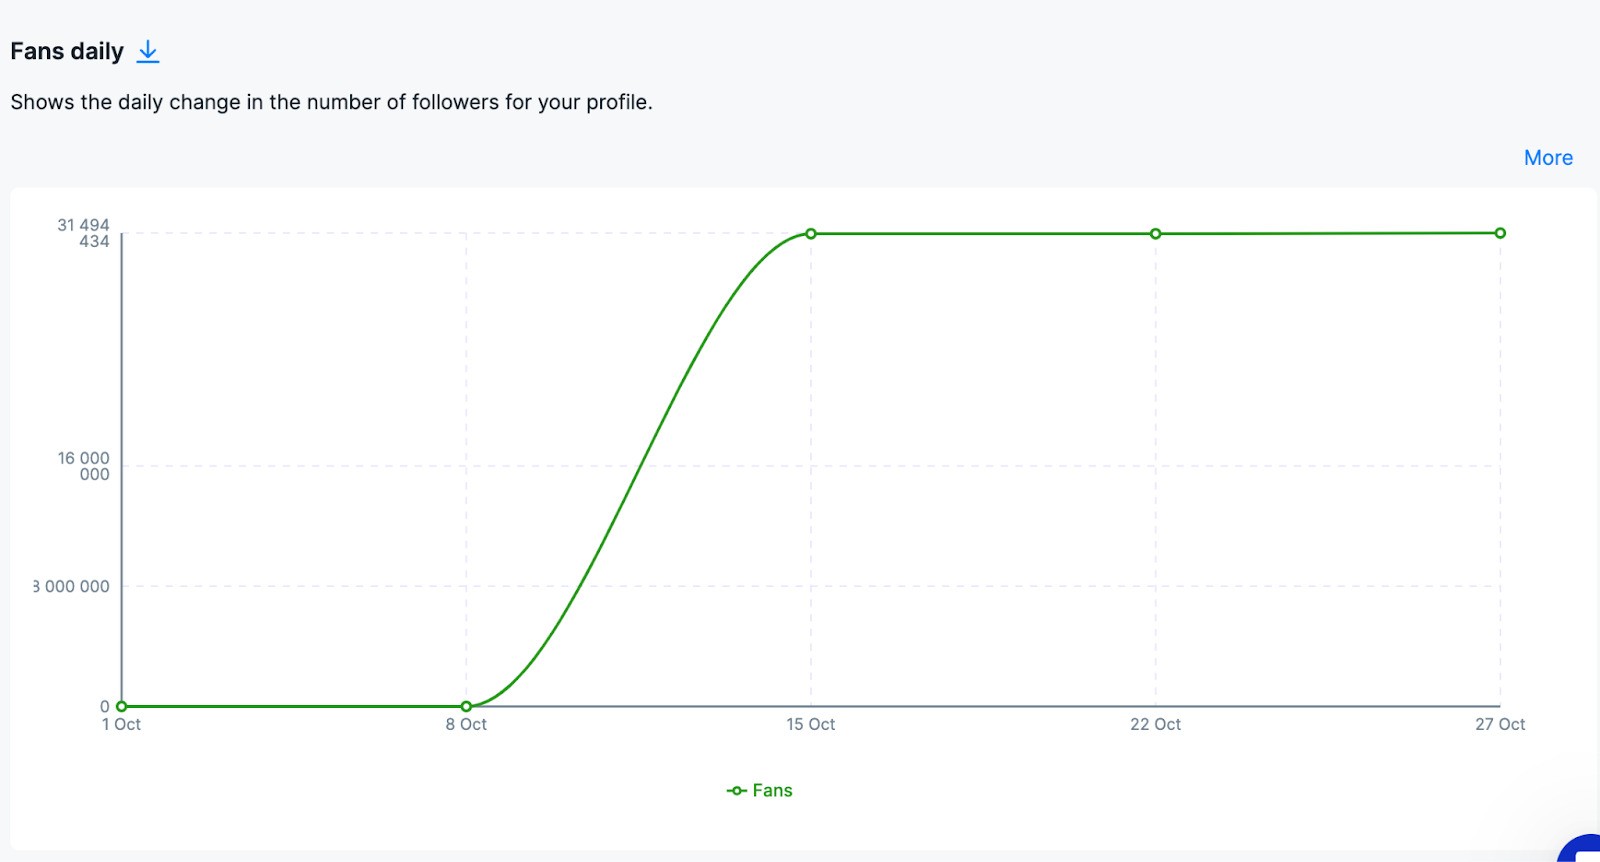
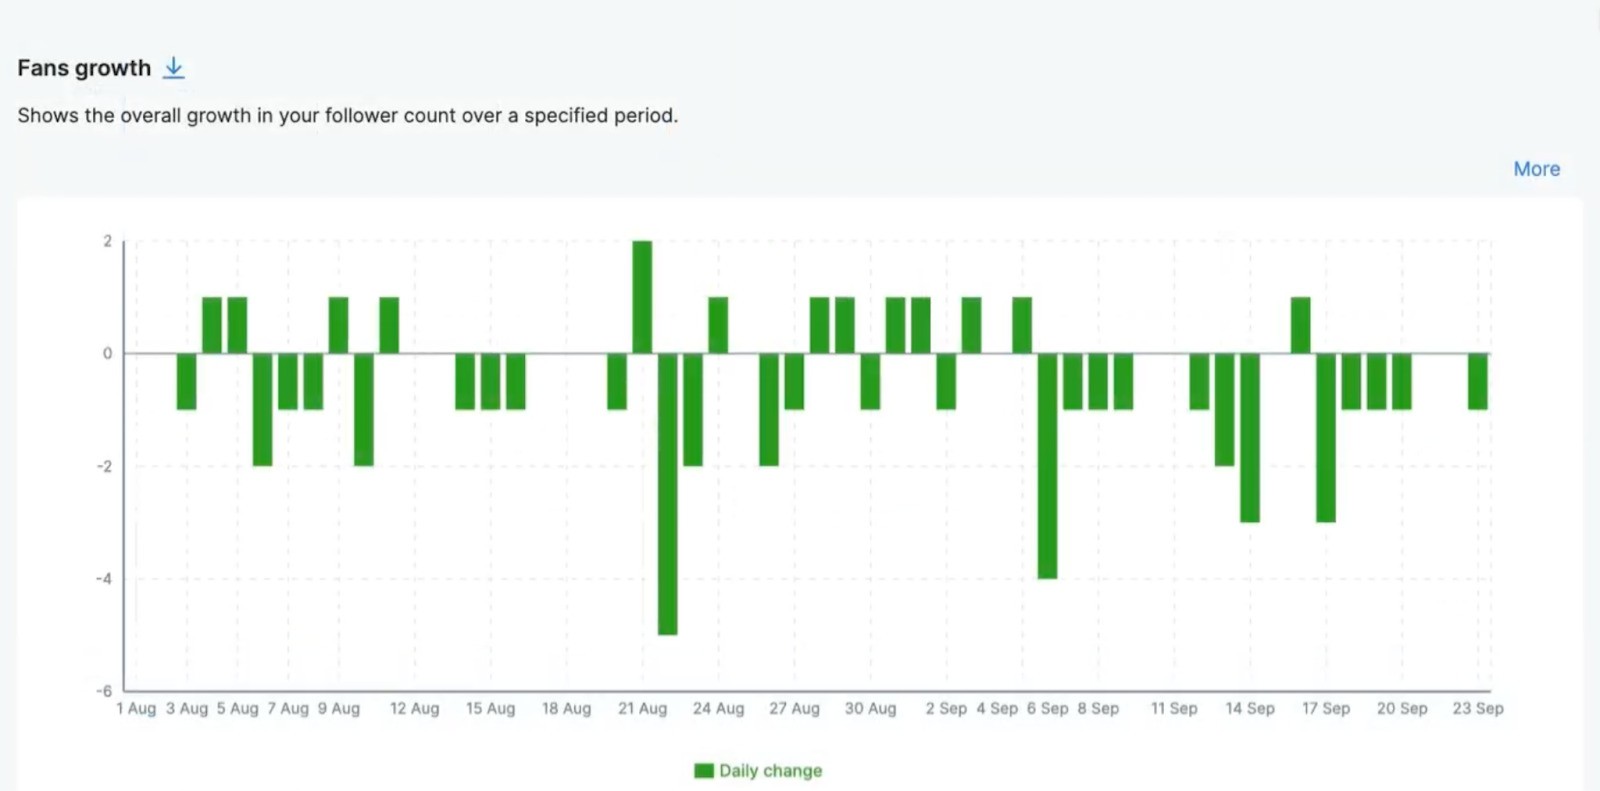
- The daily change in your Facebook page fans:
- Fan growth over time:
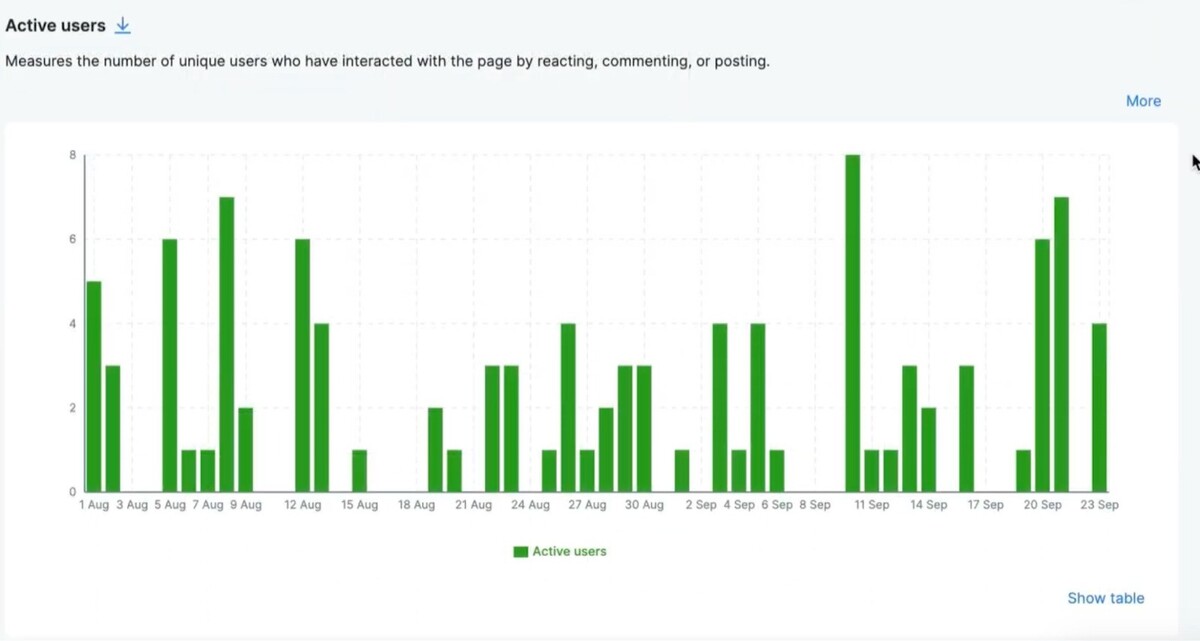
- Your page’s active users over time.
- And your audience’s geographical distribution.
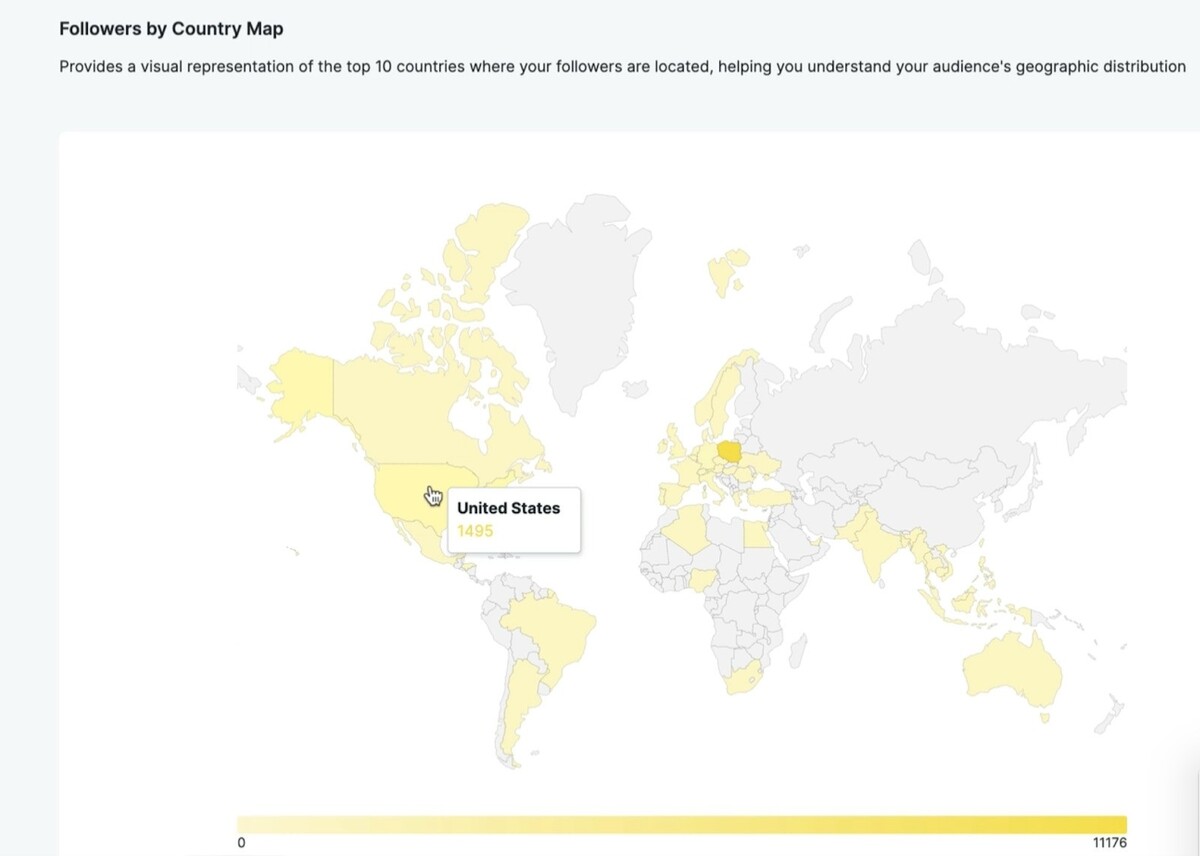
You can download the .png files with each graph. And you can also generate automated reports with all this data and graphs inside and even schedule them to get sent every month or quarter to your client or your CMO.
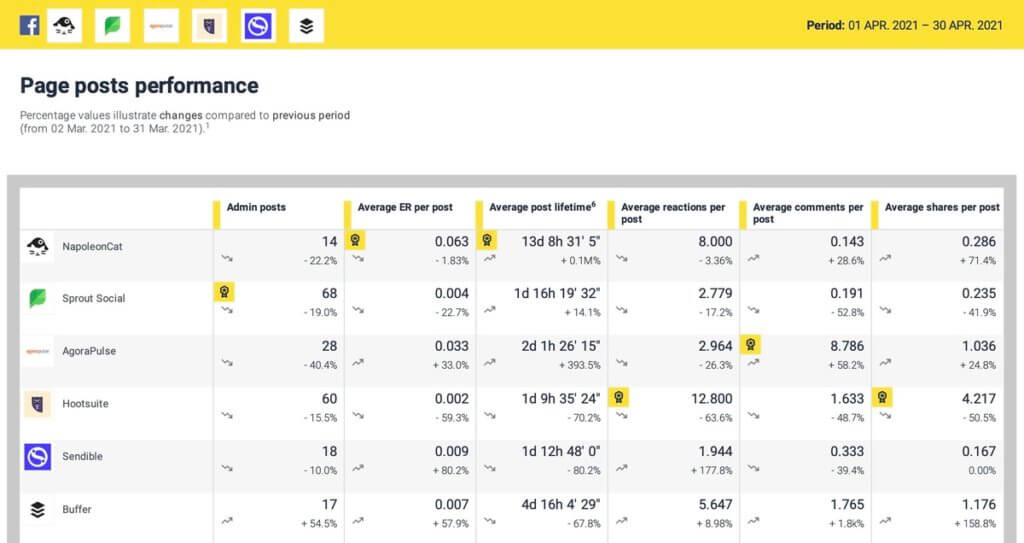
You can add up to 8 Facebook pages in a report, which makes creating competitive reports super easy, taking minutes instead of maybe days of someone’s work.
Don’t forget – reach is not everything
By all means, work on improving it to get your content out there to more people. But don’t forget it’s just a piece of the Facebook puzzle (and the social media puzzle overall). You can have high-reach numbers, but if they don’t improve business results overall, some other pieces need your attention
We highly recommend you test NapoleonCat completely for free – no credit card required 😉

Facebook Reach Calculator
In-depth Facebook Analytics. Track your performance and monitor competitors on Facebook. Generate & schedule FB reports for up to 8 Pages at once – with an all-in-one social media tool.
You may also like:
- How to Measure TikTok Engagement Rate
- How to Access and Use Instagram Insights – A Quick Guide
- How to Present Social Media Data to Clients
- Your Guide to TikTok Analytics
- How to Create a LinkedIn Analytics Report in 1 Minute
- How To Find Your Target Audience On Social Media
- How to Measure Brand Awareness on Social Media


