If you want your social media marketing strategy to work, you need to publish social media content that creates an engaged audience.
The more engaged they are with your content, the more emotionally invested they are in your brand, and the more likely they will buy (or keep buying) from you.
But how can you tell if they are engaged enough?
You do it by tracking ER (engagement rate).
Calculating ER is easy enough (as you’ll soon find out). Figuring out which formula to use? Not so much.
How do you calculate engagement rate in a way that helps deliver positive outcomes for your brand?
We have your back.
In this article, we discuss:
What is the engagement rate?
Engagement rate is the metric that measures the level of interaction your social media content is receiving from an audience.
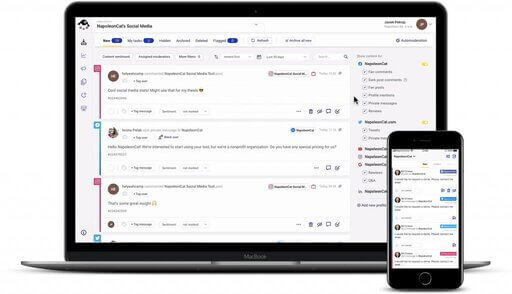
Powerful social media engagement tool
Manage all social interactions from one view. Reduce response time with one simple customer engagement tool. Try it for free:
Try NapoleonCat free for 14 days. No credit card required.
Those interactions cover many actions, including likes, shares, comments, mentions, and direct messages. With that said, the types of “engagement” you need to consider when calculating ER depend on the social media platform you’re using.
Engagement rate indicates how much impact your posts (or tweets) have on your followers or audience.
Why should you track your engagement rate?
Measuring engagement rate is essential because it’s a good indicator of content performance.
In other words, it’s a great way to measure social media marketing performance.
Having someone view your content is one thing, but having that person interact with you through your content is another. Action speaks louder than views.
We’re all guilty of falling in love with vanity metrics like views and number of followers. But while keeping track of these metrics helps, it’s more important to ensure that your content keeps your followers informed, entertained, and inspired.
After all, if you’re not publishing social media content relevant to their interests and needs, they aren’t likely to give a damn about your brand and offerings.
The right question is not how many followers you have or how many views you’re getting. It’s whether your followers are engaged enough to take their relationship with your brand to the next level. Because if the answer is ‘no,’ then it’s high time you work on your engagement rate.
What’s more, tracking your engagement rate helps give you insights into your target audience, enabling you to make suitable adjustments in your content strategy, including which content types work best, what to post, and the best times to post.
Brands and influencers are also more likely to forge a partnership with brands with high engagement. By tracking your engagement rate and making the tweaks needed to improve it, you open up opportunities for influencer partnerships to reinforce your brand and build an engaged following or community.
How to calculate ER (engagement rate)
There are many ways to calculate engagement rate, but for the sake of simplicity, let’s focus on two:
- Overall engagement of your profile
- Engagement rate for a specific post
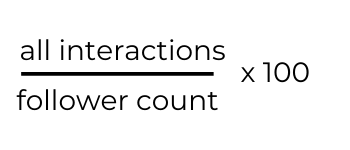
To calculate the overall engagement of your profile, simply divide the total number of interactions (likes, comments, shares, etc.) by follower count, and then multiply the answer by 100.
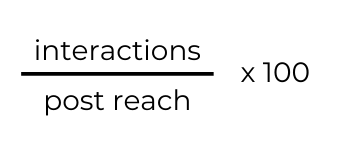
To calculate the engagement rate for a specific post, divide the total number of interactions by the post’s reach and then multiply the answer by 100.
You can decide the time frame and track progress based on results. If you want to calculate your daily engagement rate, add the number of interactions for an entire day. Want to track your monthly engagement rate? Then add the number of interactions for the whole month, and so on.
What’s a good social engagement rate?
Most marketers say you should strive for at least 1%. But usually, the best answer is “it depends.” The trick is to know what it depends on.
Before tracking and evaluating your engagement rate, keep in mind the following:
- How many followers do you have? Remember, your engagement rate tends to dip as you gain more followers.
- What social media platform are you using? What’s considered a good engagement rate depends on the social platform you’re using, including the content types, algorithm changes, etc.
When evaluating your engagement rate for each social media platform, it helps to have a good baseline with which to compare. So here’s a rundown of what’s considered a good engagement rate for each platform in 2025.
What is a good engagement rate on Instagram?
Instagram has the highest engagement rate out of all the platforms, receiving an average engagement rate of 1.94% (with carousel posts getting the most engagement and single photo posts receiving the least).ig
If you get at least 2% engagement, you’re doing fine.
To calculate ER on Instagram:
- Add the number of comments, likes, shares to Stories, and saves per post.
- Divide the result by the number of followers.
- Multiply that number by 100.
What is a good engagement rate on Facebook?
A good engagement rate is 1%. Regular status posts generated the highest engagement, while link posts earned the least.
To calculate the engagement rate on Facebook:
- Add the number of comments, reactions, shares, and clicks.
- Divide that number by the number of fans.
- Multiply the result by 100 to get the engagement rate.
What is a good engagement rate on Twitter?
The average engagement rate on Twitter is .04%. Anything above that is considered good. But if you can go over 1%, then great.
To calculate the engagement rate on Twitter:
- Add the interactions (mentions, retweets, likes, follows, hashtags, etc. )
- Divide that number by the number of followers.
- Multiply by 100.
What is a good engagement rate on LinkedIn?
Anything above 2% is considered good or excellent.
To calculate the engagement rate on LinkedIn:
- Add the engagement (likes, comments, clicks, shares, etc.).
- Divide the sum by the number of followers.
- Multiply the result by 100.
How to track your engagement rate
You can measure your engagement metrics in two ways:
- Using native insights
- Using a dedicated social media analytics platform
Using native insights
To calculate your social media engagement rates, you can access or download engagement data using the native insights feature (FB Insights, Twitter Analytics, IG Analytics, LinkedIn Page Analytics, etc.) of the social media platform you’re using to publish content.
You can even download engagement data from these platforms in a spreadsheet format, make your calculations, and then turn those data into actionable insights to create social media content that users are more likely to engage with.
Using a dedicated social media analytics tool
Collecting engagement data, entering them into a spreadsheet, and interpreting all that data into insights your clients and bosses can understand can be time-consuming.
Even more so if you’re:
- Handling multiple social media accounts
- Growing a social media presence on numerous social media platforms
If you don’t have the time (or the patience) for Excel spreadsheets (and want to get more sleep), you’re better off using a dedicated social media analytics tool.
Using NapoleonCat, for instance, lets you track your key metrics across multiple social media channels for multiple social media accounts over a custom period.
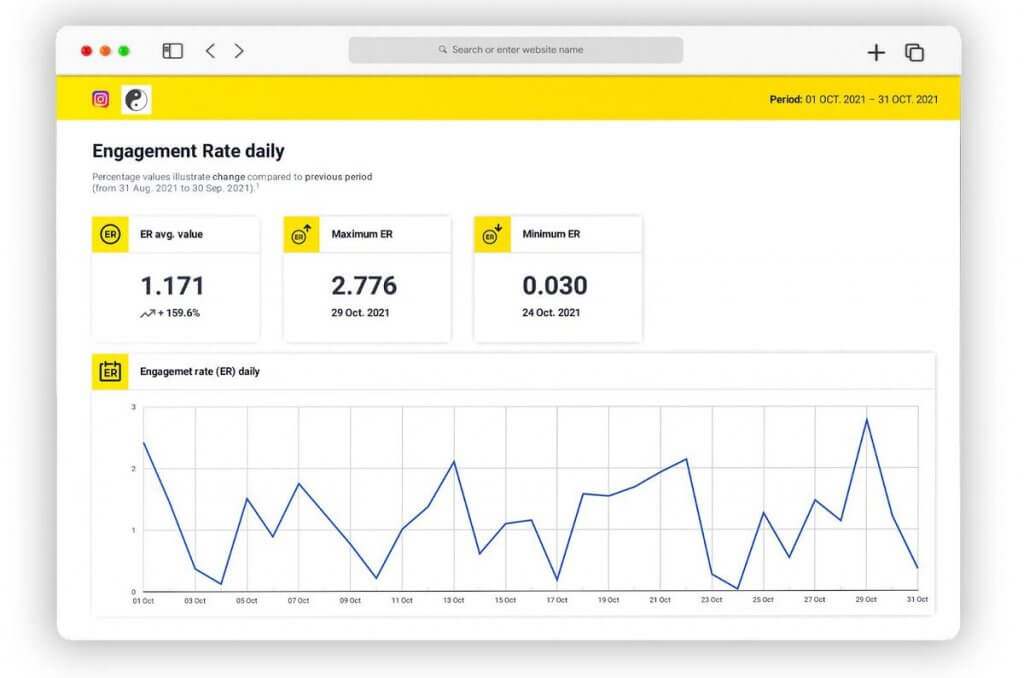
Using NapoleonCat’s Analytics feature helps you track your progress over the past months, helping you get an overall picture of your performance and spot opportunities for improvement.
When laid out like so, it’s easy to spot which posts drove the highest engagement and identify aspects that compelled your audience to interact with your brand.
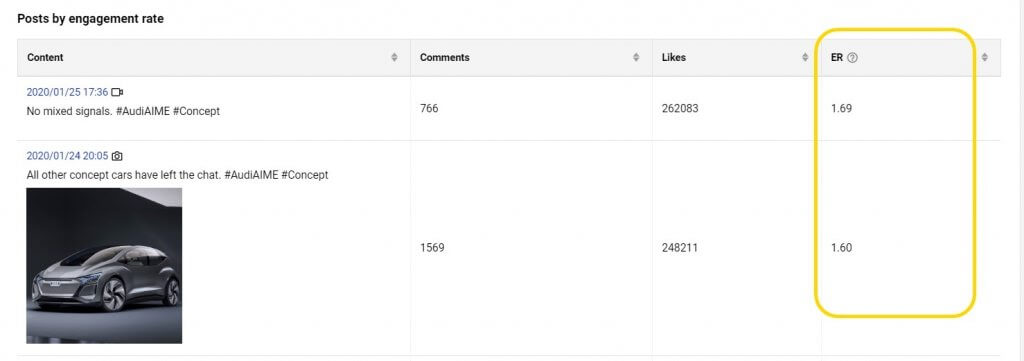
Tracking your engagement metrics can only deliver value to your brand if you know how to turn them into actionable insights that can fuel your social media marketing strategy.
A social media analytics tool like NapoleonCat helps in this regard by making it easy for you to:
- Track and collect engagement data on multiple social media platforms
- See at a glance which platforms and posts perform best
- Determine the best times to post content
- Identify which content types perform best for each platform
- Work cohesively as a team in creating more engaging social media content
- Understand your audience better
- Make better budget decisions
Why your social media engagement is low
So you’ve tracked your engagement metrics using the above steps. Now what?
Engagement metrics are only as good as the insights you get from them. Here are potential reasons why your engagement rate is low and how you can use the measured results to create more engaging social media content.
1. You’re not using the right social media platforms
Each social media network is different and appeals to a different kind of audience. For example, suppose your brand’s target audience is young moms looking for products to make parenting more manageable. In that case, it makes no sense to create branded content for LinkedIn (which is catered to professionals and businesses).
It helps to see the big picture when analyzing your performance for each social media platform. That way, you can quickly identify what works and find opportunities to do better. Or, more importantly, let go of social media platforms that don’t fit your brand and audience.
One good way to pull this off is to create social media reports.

Social Media Reporting & Analytics
Generate in-depth social media reports in seconds – for Facebook, Instagram, and Twitter. Schedule weekly, monthly, or quarterly reports. Try it for free:
Try NapoleonCat free for 14 days. No credit card required.
Again, you don’t need to use Excel sheets to do this. Using a social media reporting tool like NapoleonCat, you can create professional-looking and in-depth social media reports that will help you boost your engagement rates. Your bosses and clients will also love you more for it.
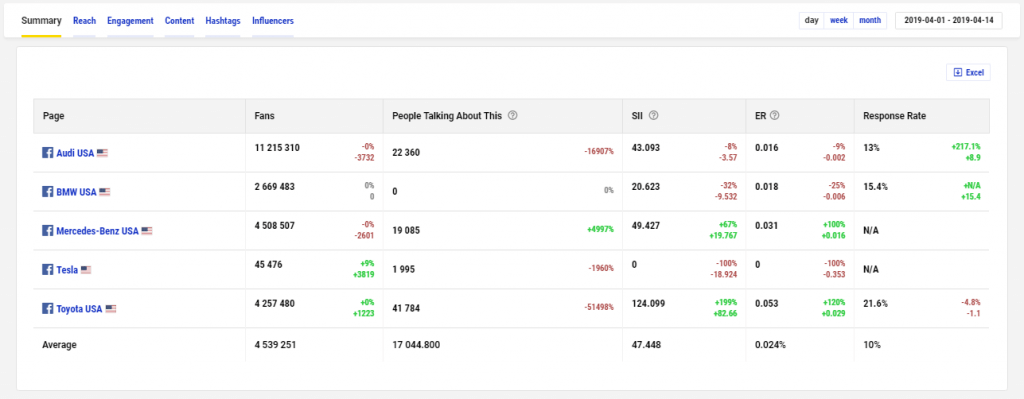
Additional tip: You can use NapoleonCat’s Analytics feature to analyze how your competitors are doing on social media. By checking which social media platforms bring them the most engagement and how their audience responds to their content, you can quickly determine which social media platforms are best for you.
2. Your posts are not interesting or relevant enough
Social media users tend to scroll past posts or tweets that are irrelevant to their interests, aspirations, and concerns.
If your social media engagement metrics are performing poorly, you need to take steps to create more engaging posts.
Learning as much as possible about your audience makes it easier to create content that appeals to them. Create original and unique content so you can stand out from the crowd. Use visuals to your advantage to grab and hold their attention.
And make sure to tailor your content based on the strengths of the platform/s you’re using. NapoleonCat’s Publisher tool helps you pull this off by using the features available to each platform without losing time on repeated logins.
It also helps to try new content formats to keep your posts fresh and exciting. For example, if your Instagram posts are not getting enough engagement, mix it up by publishing Carousel posts. Keep your audience guessing, and they’re more likely to respond in kind.
Again, you need to track your performance as you make every effort to create more engaging social media content.
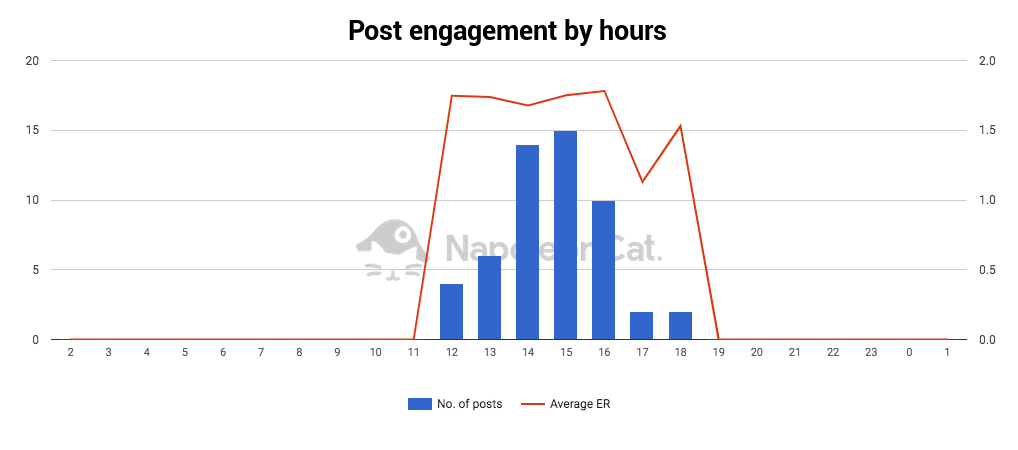
3. Find the best times to post content
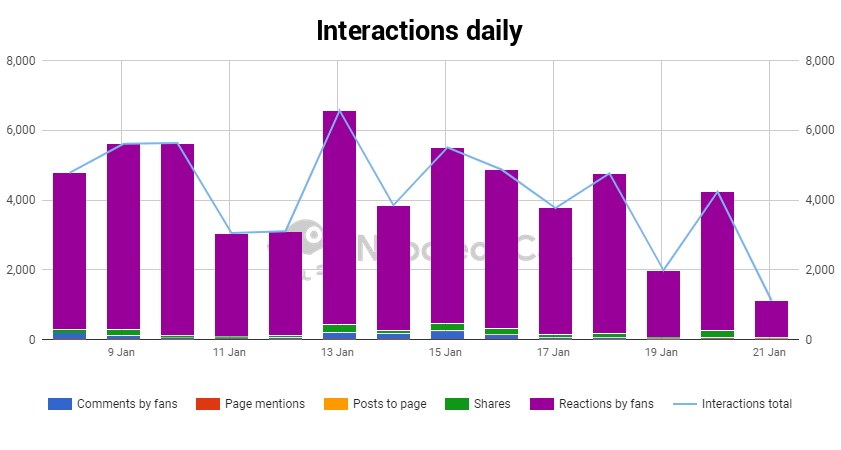
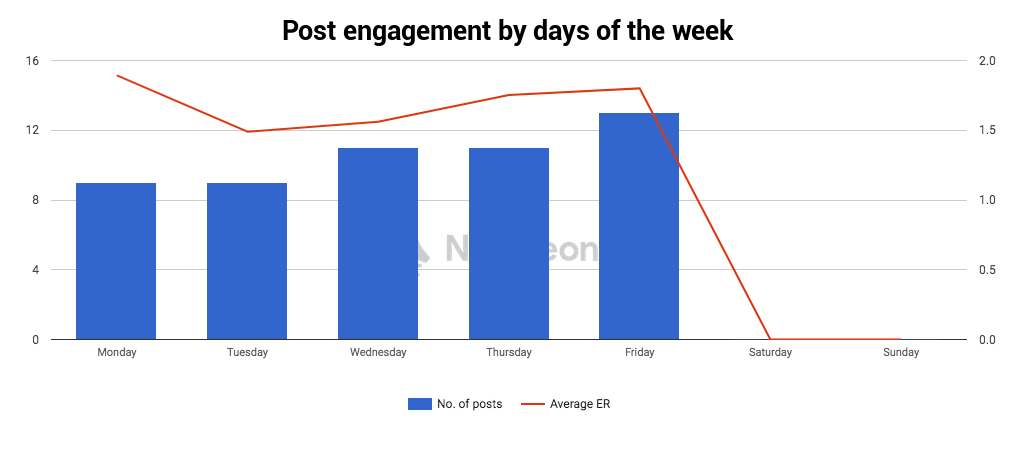
There’s no one-size-fits-all strategy when it comes to the best times to post content. If you want to get more engagement from your social media content, determine your target audience’s online activity patterns and schedule your posts accordingly.
You can identify the best times to post by visiting your social media platforms’ Insights or Analytics sections. But if you want to dig deeper into engagement data relative to time metrics, using NapoleonCat’s Analytics tool can serve you well.
4. Interact with your followers
You know the old saying, “it takes two to tango?” The same rule applies to driving more engagement in your social media marketing strategy.
Show your appreciation by liking comments or responding when someone asks you a question. That way, you’re also encouraging them to engage with you, which can bode well for your engagement rate.
With that said, as your brand gains more fans and followers, you’ll discover that you need an entire social media team to keep up with all interactions.
You can’t create an effective team if they’re working in silos. To create a cohesive environment for team collaboration, using NapoleonCat’s suite of collaboration tools can help.

Schedule posts for FB, IG, Twitter, LinkedIn, and Google My Business
Schedule posts across multiple accounts and social networks at once. Try NapoleonCat for free:
Try NapoleonCat free for 14 days. No credit card required.
Wrap up
Tracking your engagement rate can help you determine which posts are performing well and what you need to do to make your audience more invested in your brand. If you want your social media posts to deliver positive outcomes for your business, leave vanity metrics behind and pay more mind to metrics that help you improve your relationships with your audience.

