
Save hours on social, every day.
Automate moderation and replies, schedule posts, and pull reports - all in one tool.
If you’re here, you probably have a report to make for your client to prove how well you’ve taken care of their social media accounts. You’re great at your job, but your client doesn’t have to be fluent in social media marketing – if they were, they probably wouldn’t need your services. You want to prove to them that your strategic thinking and social media expertise are paying off and that the social media activities you have been performing on their behalf are bringing in the desired effects.
Comprehensive reporting should be perceived as more than just a dull administrative task – it also gives you the chance to showcase your results and highlight your successes.
Why is comprehensive reporting critical?
I know it may be evident, but let’s start from the very basics. Why is reporting important, anyway? An excellent social media marketing report should give your client an overview of their whole social media presence and show if, how, and what you have improved in their social media strategy.

Schedule automatic reports for Facebook, Instagram, and Twitter
Schedule weekly, monthly, or quarterly reports for different social media platforms. Try it for free:
Try NapoleonCat free for 14 days. No credit card required.
In order to put one together, you need to know what data to follow and why, and be able to put it into context. Growing your client’s fanbase by 1000 new followers in itself doesn’t say much if you don’t know how many percent the growth constitutes (1,000 new fans for an enormous account like Coca-Cola is almost negligible) and what caused it. Was it the viral content you posted? Was it the effect of a paid campaign? A well-crafted report will help you answer such questions and provide comprehensive, data-driven insights to your client (and yourself).
But detailed and comprehensive doesn’t necessarily mean overloaded with data. A useful report doesn’t have to be long. It has to show the most important metrics, as well as actionable advice, concluded from the data.
Reporting your activities and the effects of your work to your clients justifies their investment in your services. Part of your job is convincing them that their money is well spent. Regular reporting illustrates the progress you make and helps with identifying potential threats and obstacles in achieving marketing goals.
The most popular timeframes for client reports are monthly (or every 28 days, because months vary in length) and quarterly (or every 90 days).
The most important metrics in social media reports
Depending on your client’s campaign goals and the broader social media marketing strategies in place, you should focus on different parameters to varying degrees. There are some metrics and areas of social media activity, however, that you should include in every report. They are: reach, engagement rate, content, and customer service. Let’s look at them in more detail.
Reach
Reach can be treated as more of a category than a single metric. It can be divided into several parts, each of them presenting different aspects and ways of reaching people in social media. The three most important are: following, reach per se, and impressions.
Your social following is the total number of people who follow your social channels. They’re named differently on different platforms: subscribers on YouTube, fans on Facebook, followers on Instagram, etc. Remember that Facebook distinguishes fans and followers – the former like a Page (but don’t have to follow it) while the latter don’t like it, but follow what it posts.
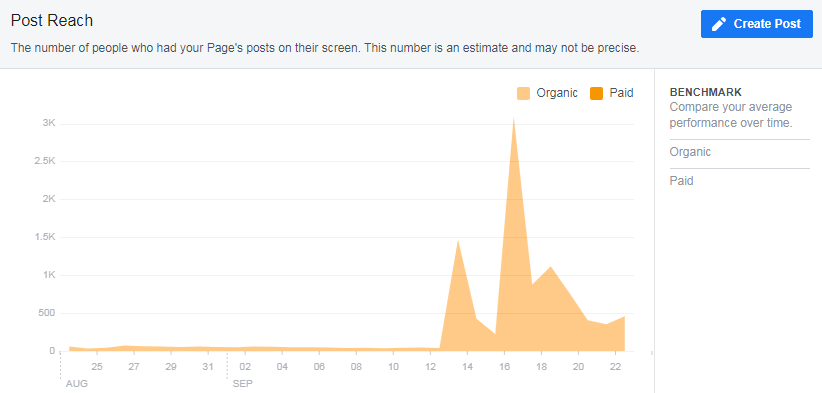
Reach per se is the number of unique users who you’ve reached with your content. Even if they view your posts more than once, it doesn’t matter – they still count as one. Dividing your following by reach shows how well you penetrate your social base with your content. The higher the percentage, the better.
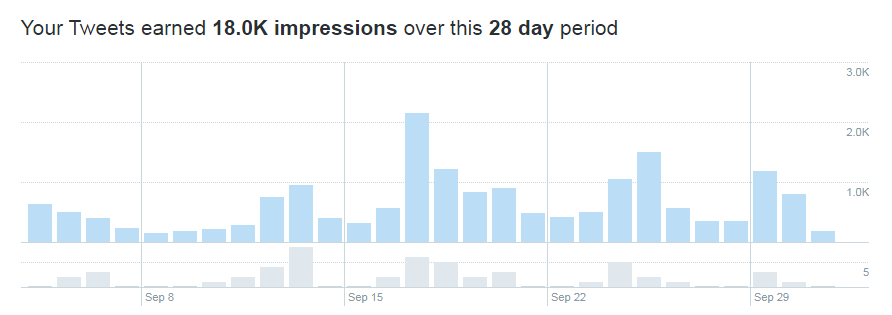
Impressions indicate how many times your content has been viewed. Every view in a user’s feed counts. If a person saw your content twice, you got two impressions. Not every social platform shows impressions. Some, like YouTube, don’t. In this particular case, the closest metric is views. Twitter on the other hand only reports tweet impressions. Don’t forget about these differences in your reporting and, if necessary, explain them to your client.
Engagement
Social media are about engagement – you want people to react to your content. Engagement is often the first step to converting social followers into customers, which is why it’s so important in client reports. Low engagement per post usually means that content is not well-suited for the target group (or, conversely, your fanbase doesn’t belong to your ideal target group).
Negative engagements also exist. Thumbs down on YouTube or Angry or Sad reactions on Facebook can be early signs of a future image crisis. It’s important to include total engagements in your reports – even if some of them are negative – and help your client adjust their strategy accordingly.

Social media reporting for agencies
Streamline your process with customizable reports and automated delivery to team members, clients, and stakeholders. Generate in-depth social media reports in seconds. Try it for free:
Try NapoleonCat free for 14 days. No credit card required.
Content
Content is king, isn’t it? Measuring, analyzing, and reporting data on your content helps you decide if it resonates with your audience. Dividing your content analysis by type (video, image, link, text) and by topic (product updates, promotions, branding, memes, etc.) shows exactly what and how you should post. The easiest way to analyze the efficiency of various content segments is to sum up reach and engagement of each section and divide it by the number of posts in them. The higher the number, the more effective the section is. This information should be present in the reports you put together for your clients
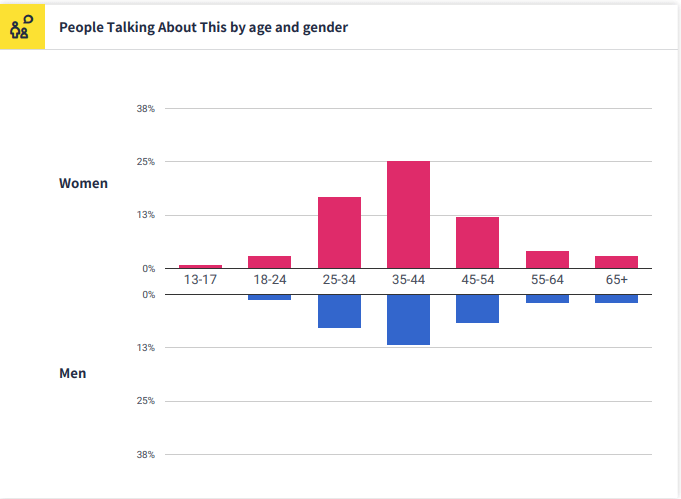
Demographics
Many social media platforms provide you with information about audience demographics. The most detail is provided, as you rightly guessed, by Facebook. Analyze the age, gender, and location of your following and see if they match your ideal target audience. Report changes in your follower base and people reached by your content.
Tools for creating social media reports
Most social networks provide you with built-in analytics tools: Facebook & Instagram Insights, Twitter Analytics, YouTube Analytics, LinkedIn Analytics, etc. They offer an array of data that you can report to your client. Again, the most detailed data is offered by Facebook Insights. On top of demographic data, it provides information regarding reach, impressions, and content as well as detailed insights on your audience’s activity patterns on Facebook and Instagram.
The downside of using default social media analytics tools is that you have to crunch data on your own – and raw data can be challenging to deal with.
Google Analytics is a powerful tool. You can measure almost everything in it, including which devices users use to access your site, your effectiveness outside of social media, referral traffic, and ROI of your campaigns. Using Google Analytics, you can create custom reports for your clients. Use it to measure which social platform is the most efficient in directing users to your website and the quality of the traffic (how long they users on your site and how many pages they visit). Reporting these metrics is crucial in fine-tuning your clients’ digital presence.
Social media analytics tools
Putting together social media reports can be a mundane and time-consuming task, especially if you have to prepare them on a regular basis. Did you know that the process can be automated? There are tools that can help you make custom nice-looking reports with just a few clicks of work. NapoleonCat is one of such tools.
NapoleonCat’s automated solutions make reporting for clients so much easier. You select the data and metrics you want to include in your report, add your logo (or remove ours) and voila! You can also add descriptions and extra pages where necessary, and download your creation as a PDF or XLS file. Your report will be ready within minutes.
Save time by scheduling automatic report delivery to team members and clients. They will get brand new, shiny reports delivered straight to their inboxes! You can choose between weekly, quarterly, and monthly reports. This is what we call quick and frictionless reporting.
Below you can see how easily you can create a social media report using NapoleonCat (sample report is shown at the end of the video):
Social Media Reporting: Best Practices
Last but not least, I prepared a quick set of rules you should follow when preparing a report for a client. There are some things you need to include in your social media reports and some that you should never ever do.
DONT’S:
- I can never stress it enough – don’t lie in your report. Don’t conceal bad news or negative outcomes. Be sincere, even if it might hurt your position. Explain what failed and how you want to fix it. Failures are a valuable experience, learn from them.
- Don’t overload your client with meaningless data. I promise you, they won’t read the whole report if it’s cluttered with incomprehensible charts and figures. Data without insights is useless. Draw conclusions from data and present them to your client, suggesting solutions to existing problems.
DOS:
- Make your report easy comprehensible and good-looking. Plain numbers and ugly charts are boring, and you don’t want your report to be boring – you want it to be informative. All the tables and figures should be explained. Use data visualization tools.
- Report regularly. Pretty obvious, but it’s a must. How else will you show your progress to your client?
- Use tools that make reporting faster and easier. Just like I wrote before, crunching data manually can be hard and mundane. Use suitable tools that will automate the process for you.
- Analyze your competition. Reporting how your competitors succeed (or don’t) in social media shows your client their brand’s position in the market.
- Answer your clients’ questions and needs. When you start working with a new client, discuss not only the general strategy and goals but also how often they want to be updated, what report format they find the most helpful, etc.
I hope this quick guide will help you impress your clients with your social media performance!

Facebook, Instagram, and Twitter reports
Generate in-depth social media reports for your own accounts as well as competitors' profiles. Try it for free:
Try NapoleonCat free for 14 days. No credit card required.