Save hours on social, every day.
Automate moderation and replies, schedule posts, and pull reports - all in one tool.
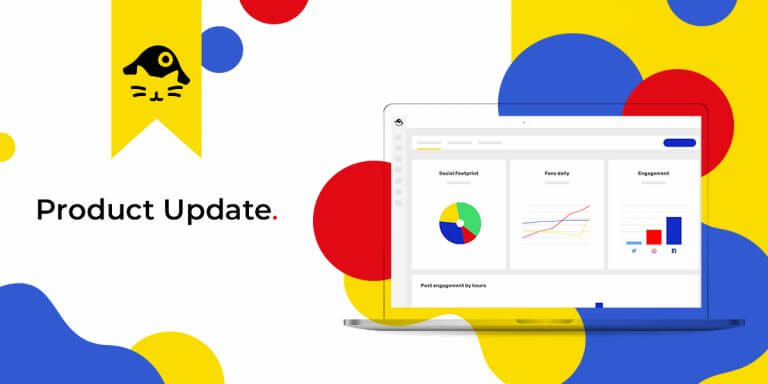
NapoleonCat’s Analytics help businesses measure and understand social media performance across multiple channels and platforms. In our latest product update, we’ve added LinkedIn to the list of social networks you can track with NapoleonCat.
LinkedIn is an effective tool for reaching businesses and prospective employees on social media. The platform has been growing exponentially over the last few years and just surpassed 675 million members. And, while the numbers might still not come anywhere close to Facebook or Instagram, LinkedIn is a valuable social media marketing tool for B2B businesses looking to communicate with professionals.
Here are all the ways you can analyze your LinkedIn Page performance with NapoleonCat’s Analytics.
Getting started
In order to analyze LinkedIn with NapoleonCat, you need to add a managed LinkedIn account to your project. In order to do this:
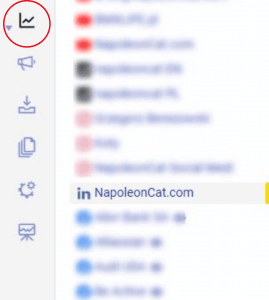
- Access your Workspace Settings (formerly Project settings) through the bar on the left side of the screen
- Click ‘+Add managed profiles’
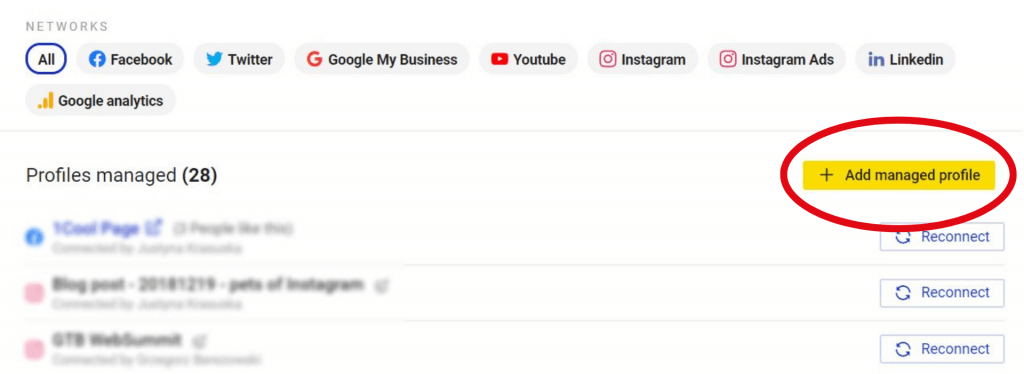
- Select LinkedIn from the list of available social networks
- Following the prompts in the pop-up window, sign in to your account and allow the necessary permissions
- A list of company pages associated with your account will show up – click the ‘+Add profile to project’ button to proceed
Et voilà! Your Linkedin Page has been connected with NapoleonCat.
Please note that fetching data might take up to 24 hours. NapoleonCat starts collecting data when you connect your profile – limited historical stats will be available through our Analytics.
Summary
Once you add a LinkedIn Page to your project, you can access it through the menu on the left side of the screen in the Analytics module:
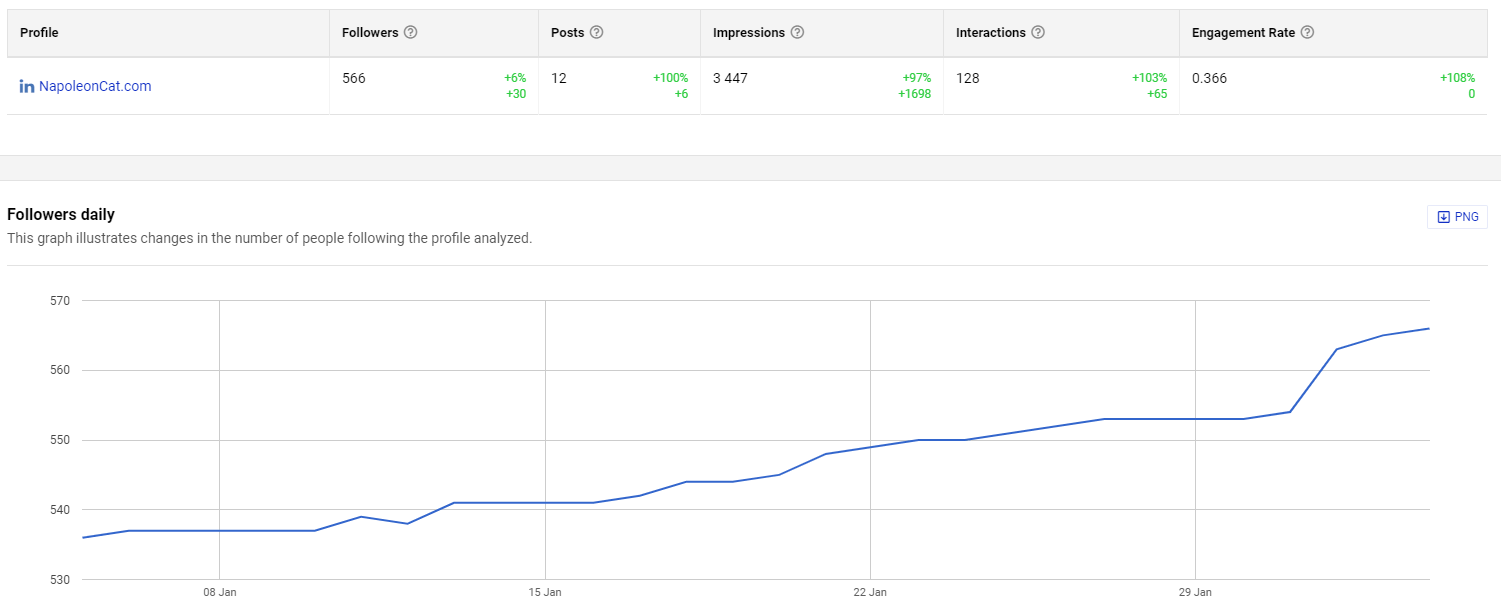
Once you click the Page you wish to analyze, you will automatically be taken to the Summary section. This is where you can find a high-level overview of your LinkedIn Page, including:
- your total number of followers
- the number of posts you have published
- the number of impressions
- the number of interactions your content has generated
- your engagement rate
- a graph showcasing follower growth over a specific period
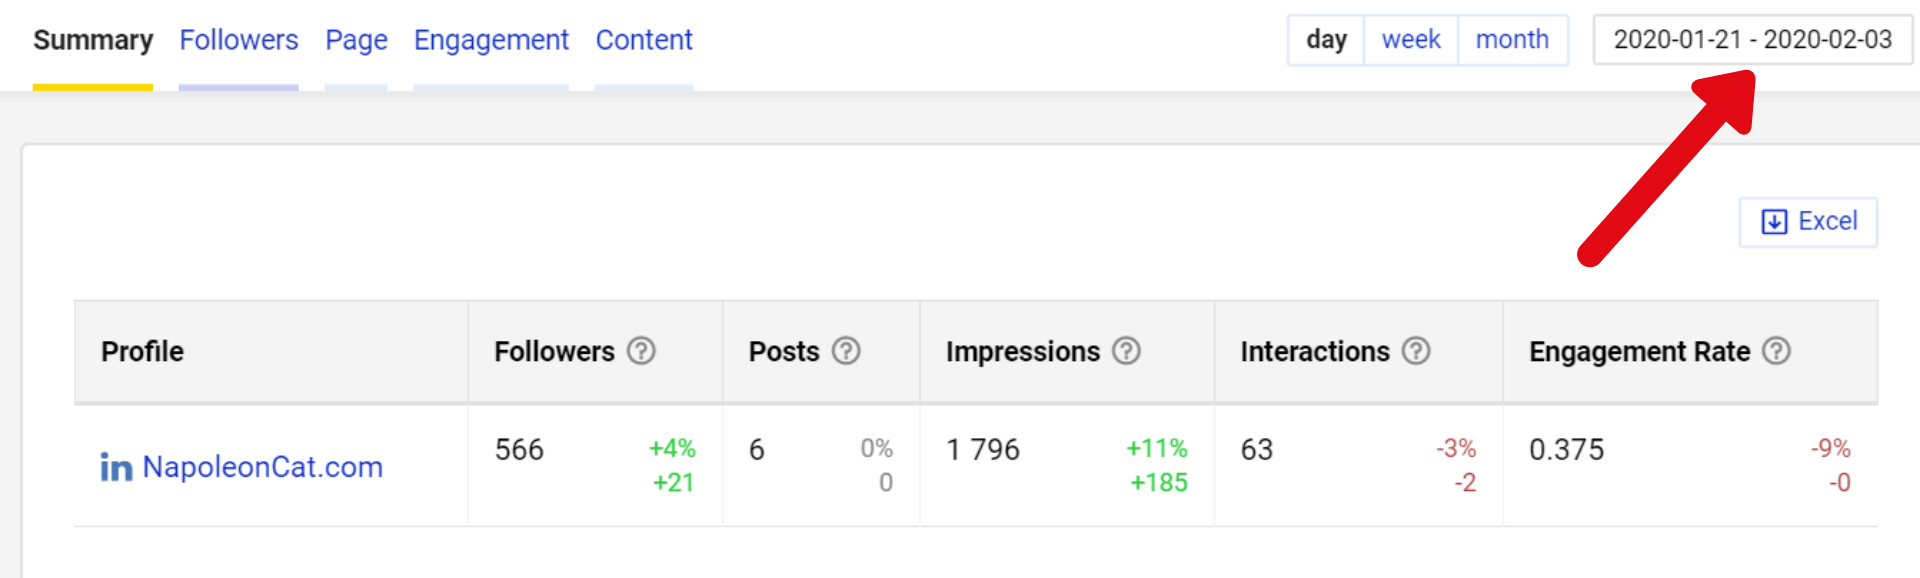
The data can be downloaded in the form of XLS or PDF files. You can select the time period you would like to analyze in this section in the top right corner of your panel.
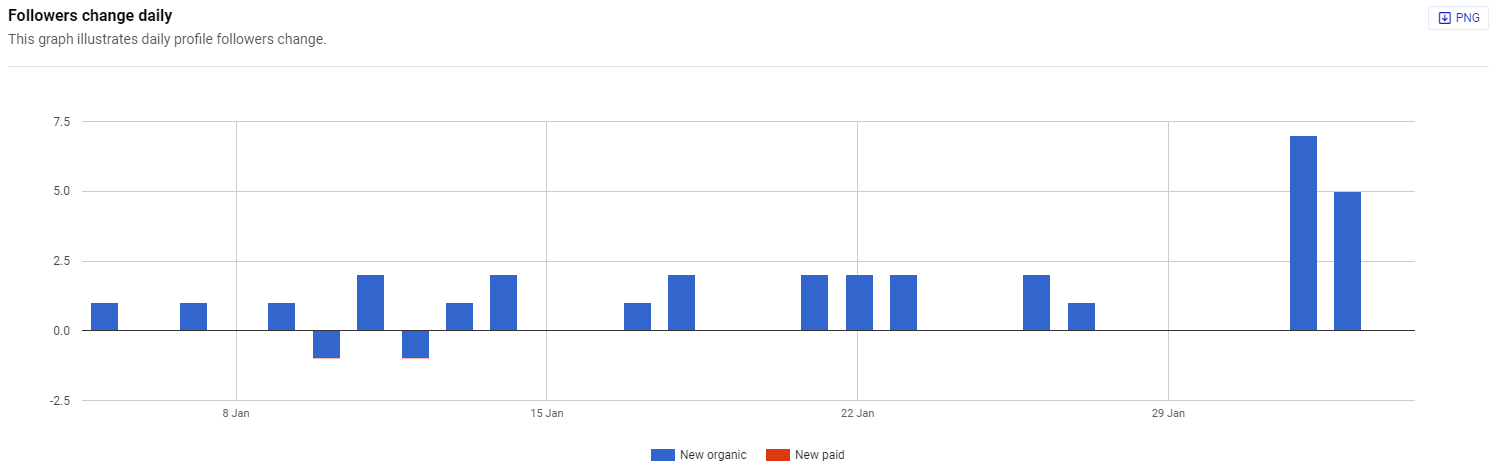
Followers
The Followers section offers a more in-depth analysis of your LinkedIn following. For any defined time period, you can analyze the fluctuations in total, organic, and paid follower count.
Page
The Page tab offers insights regarding impressions and mentions generated by your Page over a defined period of time.
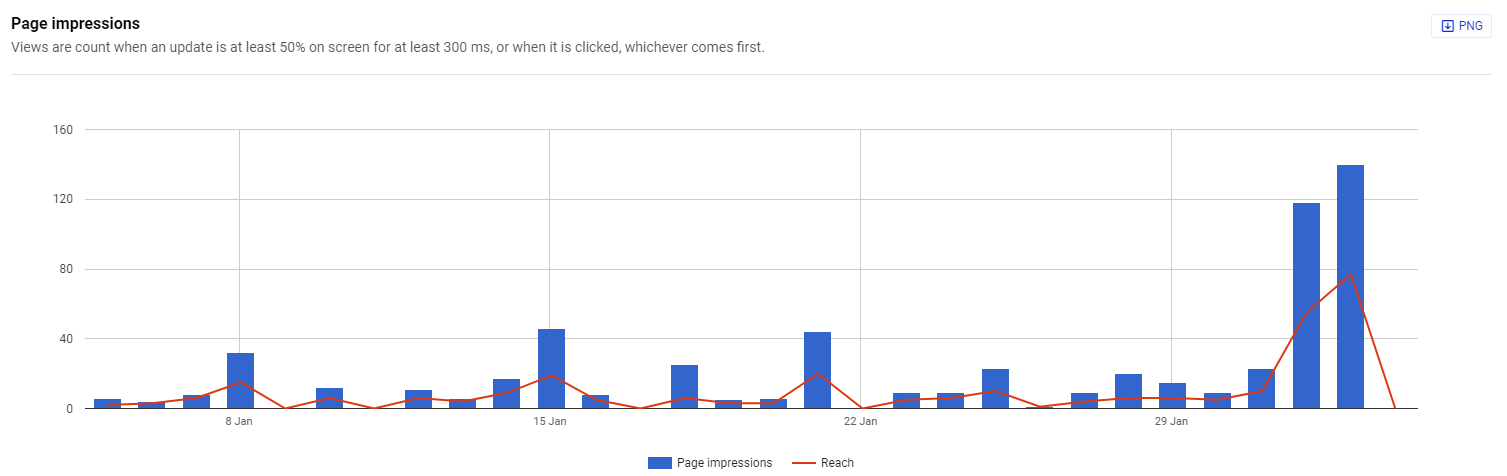
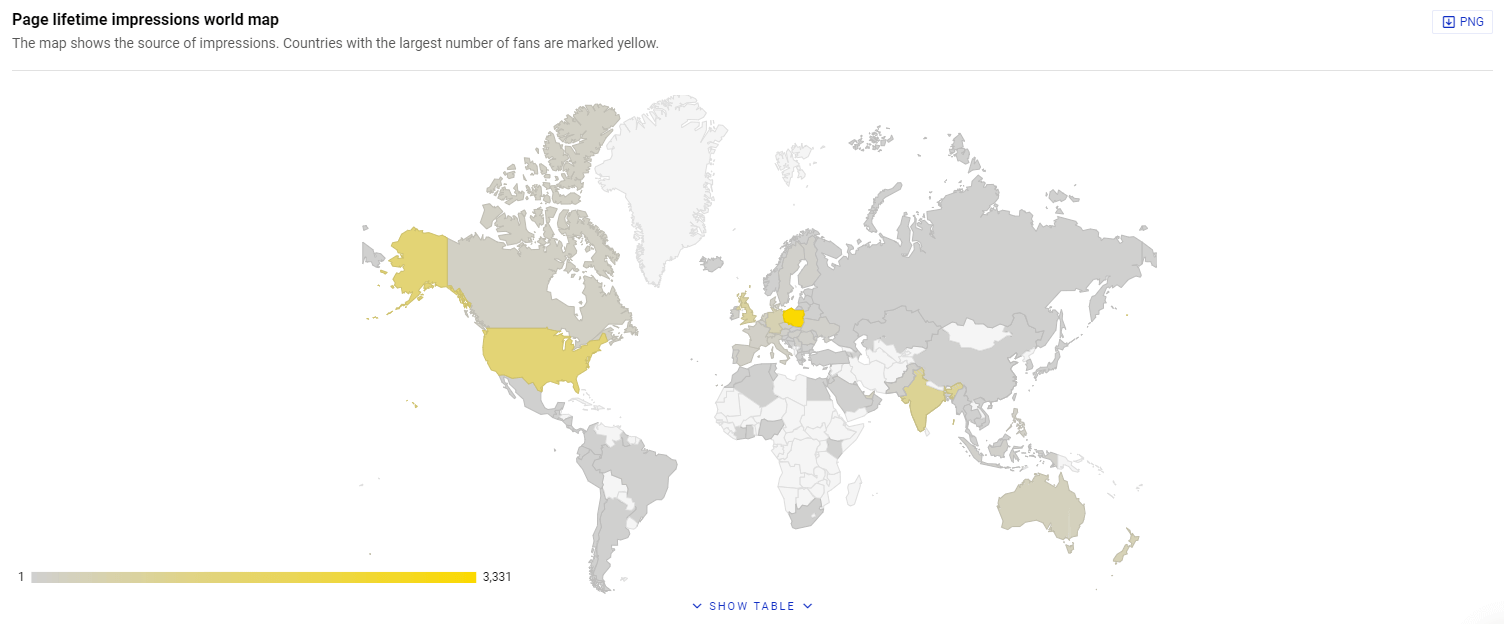
You can also check where your impressions are coming from as well as look up your Page’s lifetime impressions count in this section.
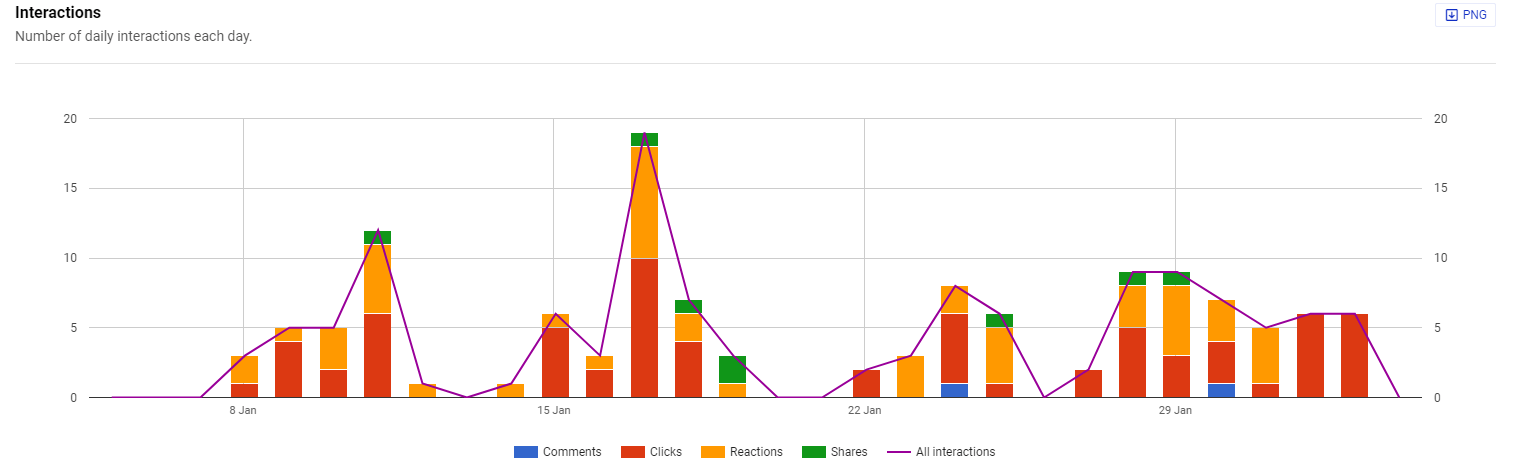
Engagement
In this colorful section, you can analyze how LinkedIn users interact with your page. Interactions are divided into comments, clicks, reactions, and shares.
As the name itself suggests, you can also analyze your engagement rates in this tab. Note that two types of ER are presented in this section:
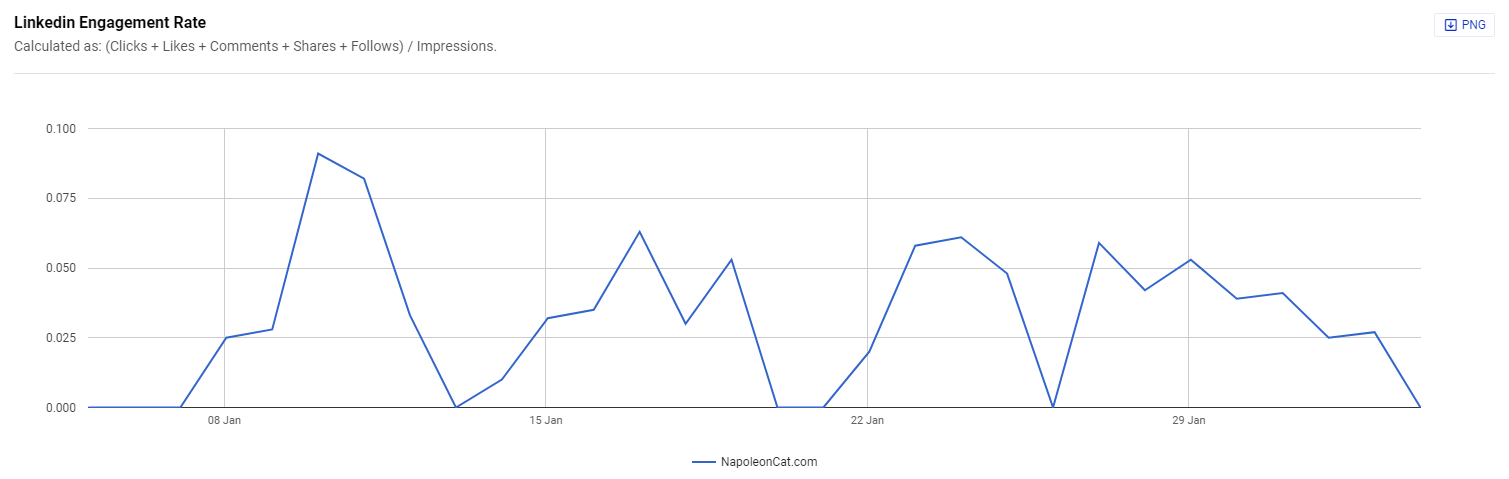
LinkedIn Engagement Rate
LinkedIn calculates ER by dividing the sum of interactions (clicks, likes, comments, shares, and follows) by the number of impressions.
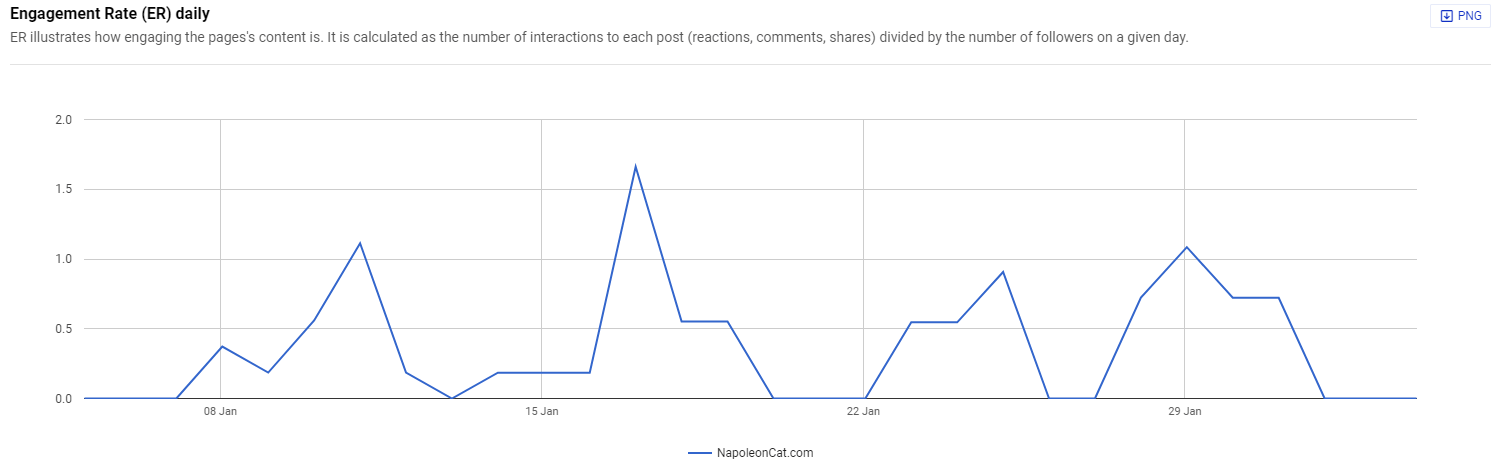
Daily Engagement Rate
NapoleonCat’s definition of engagement rate is slightly different. We divide the number of interactions to each post by the number of Page followers on a given day.
Content
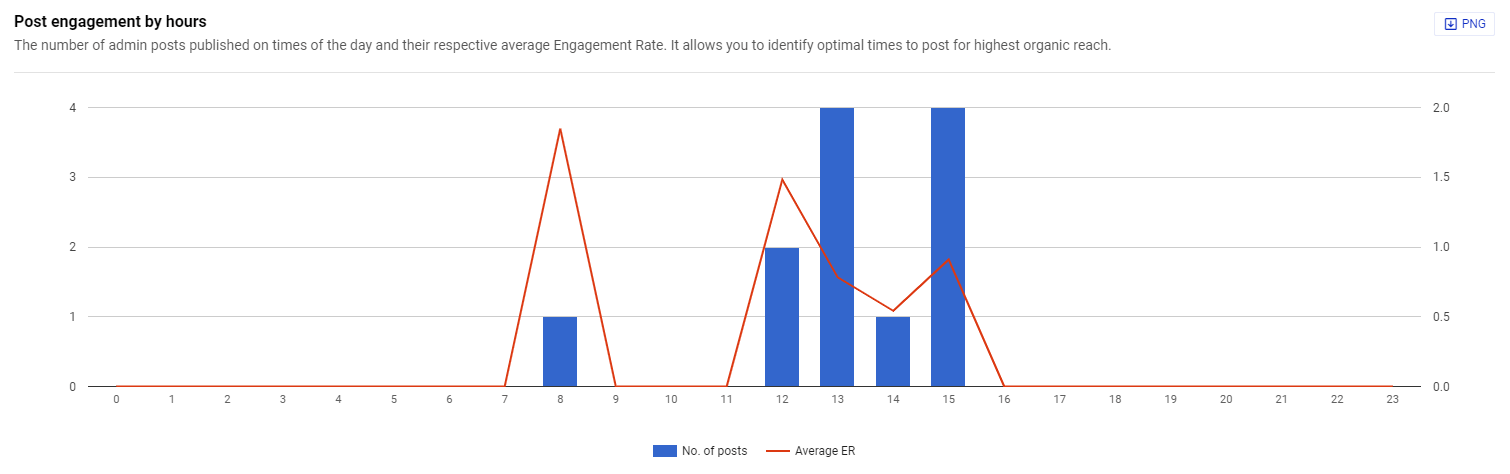
The last tab offers insights regarding content posted over a defined timeframe. Using this section, you can analyze the collective impressions, reactions, comments, shares, clicks, and ER for all your posts as well as look up the best times to post, based on actual data showcasing when your audience interacts with your content.
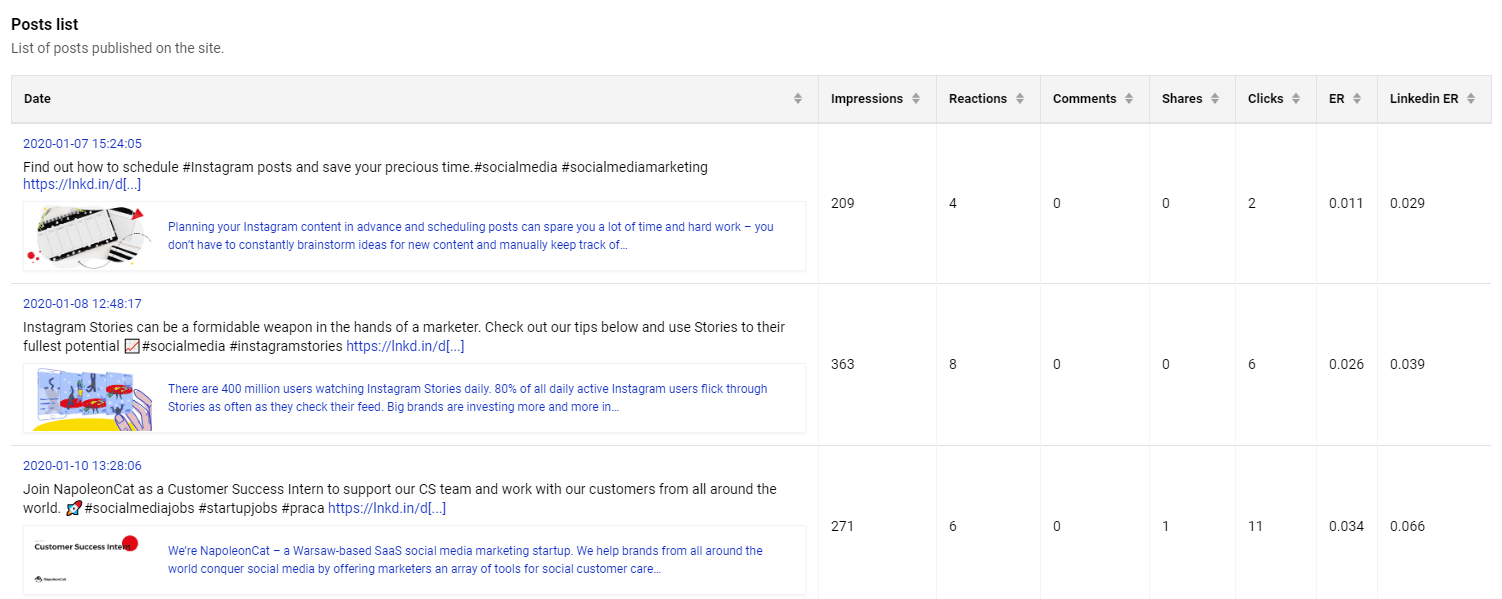
The tab also features a comprehensive list of posts published during the specified period and relevant stats for each update.
Test the new feature today
Sign up for a free trial, and start analyzing LinkedIn alongside all your other social profiles.
Social media analytics
Measure your social media marketing results and improve performance using simple dashboards.
Try NapoleonCat free for 14 days. No credit card required.