
Save hours on social, every day.
Automate moderation and replies, schedule posts, and pull reports - all in one tool.
Thinking of shifting your marketing efforts to Instagram? Already planning a dedicated Instagram campaign? First, make sure you know how to measure its performance.
Until recently, Instagram was an additional tool in the social media marketing suite. When the platform reached 1 billion active users in June 2018 (confirming its 5% quarterly growth), while Facebook’s growth stalled, marketers started taking Instagram more seriously. As a consequence, we’ve seen more and more brands shifting their outreach campaign efforts to Instagram.
Taking on the test-and-learn approach is a must – but how do you know if you’re winning Instagram hearts as well as hitting your marketing objectives?
Are you ready to launch a social media campaign with Instagram as the key channel?
Before you allocate your marketing budget, it’s good to know how to measure your brand’s performance on Instagram.
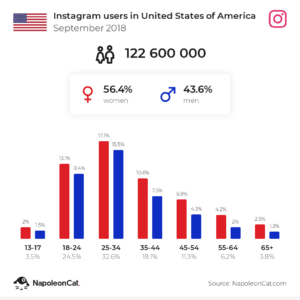
Why not start by looking at the user demographics for the country or countries you want to target with your campaign? Use this free tool to see current data for any country in the world.
Now that you have an idea of your campaigns potential to reach the desired audiences, you can dive deeper into designing your objectives.
Here are the questions you should ask yourself before launching a big marketing push on Instagram – and – the key metrics you need to be able to answer them:
1. How many people are seeing my content on Instagram
Metrics: followers and reach
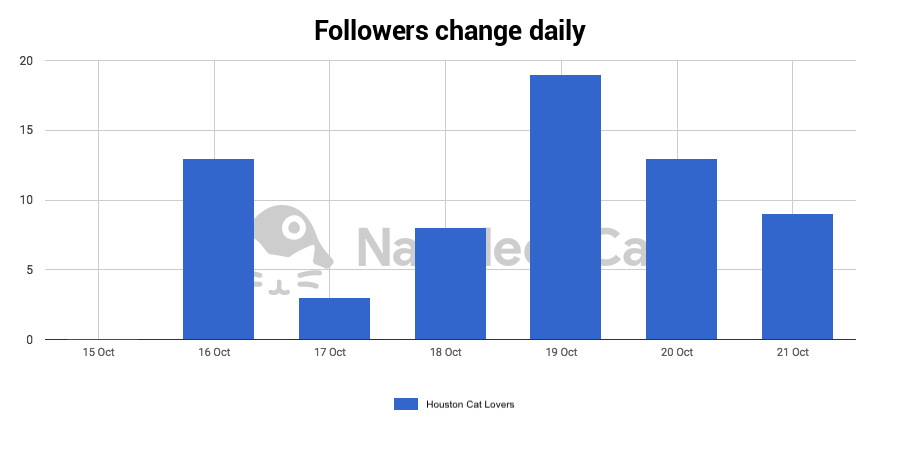
The most obvious metric is your number of followers – something that matters mainly because it’s public and indicates how popular your brand is. In fact, you can get more out of this metric. For instance, you could look at the daily increase of follower growth over time to pinpoint which posts performed better in terms of growing your profile.
Here, a post on 19 October had a much greater impact on the number of new followers:
So, your number of followers is not just a vanity metric, that’s great. However, looking at it in isolation, won’t tell you much about how your content is performing. If you are putting content on Instagram, what you really want to see is how many people actually people saw it. The number of users that saw your content or those who visited your profile page are both good indicators of whether your campaigns are working or not.
In NapoleonCat, you can see the exact number of users who saw your content on a given day, which lets you know how many eyeballs you managed to get on your content that day as well as estimate the best days for posting. You can also take a closer look into your followers’ demographics to check if you’re reaching the the right target groups.
Social media analytics
Measure your social media marketing results. Track competitors and improve performance using simple dashboards.
Try NapoleonCat free for 14 days. No credit card required.
2. Is my Instagram content engaging enough?
Metrics: daily interactions, engagement rate, engagement per post
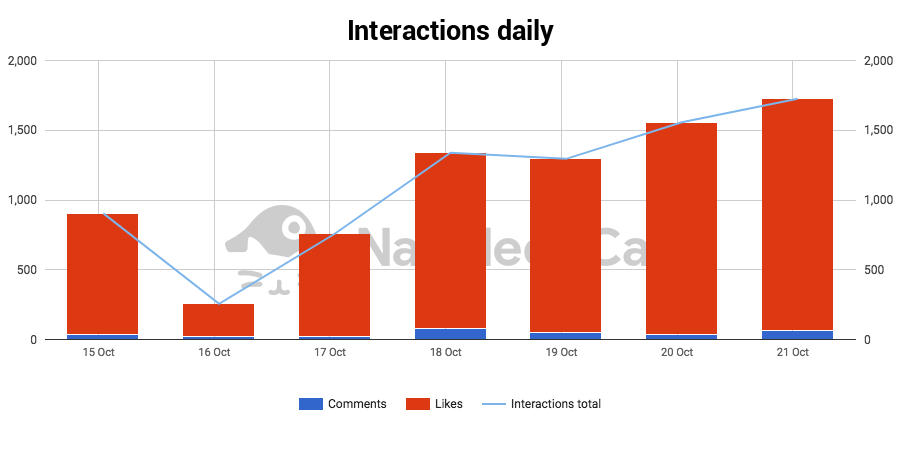
Keeping track of your followers is just the starting point. The juicy metric that will give you feedback on whether your Instagram campaign is working, is your engagement rate. It’s calculated as the number of interactions to each post (likes, comments) divided by the number of followers on a given day.
Here, you can see how many interactions took place each day:
You can also look at the number of posts in a day and how that influenced your engagement rate:
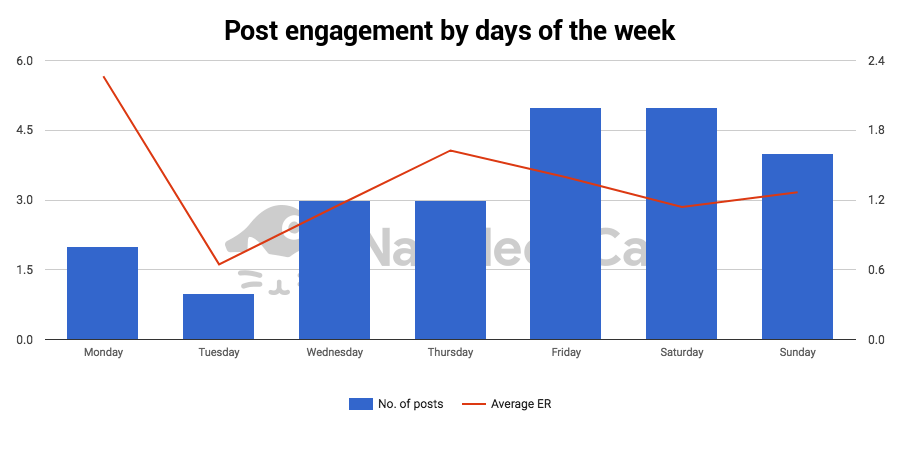
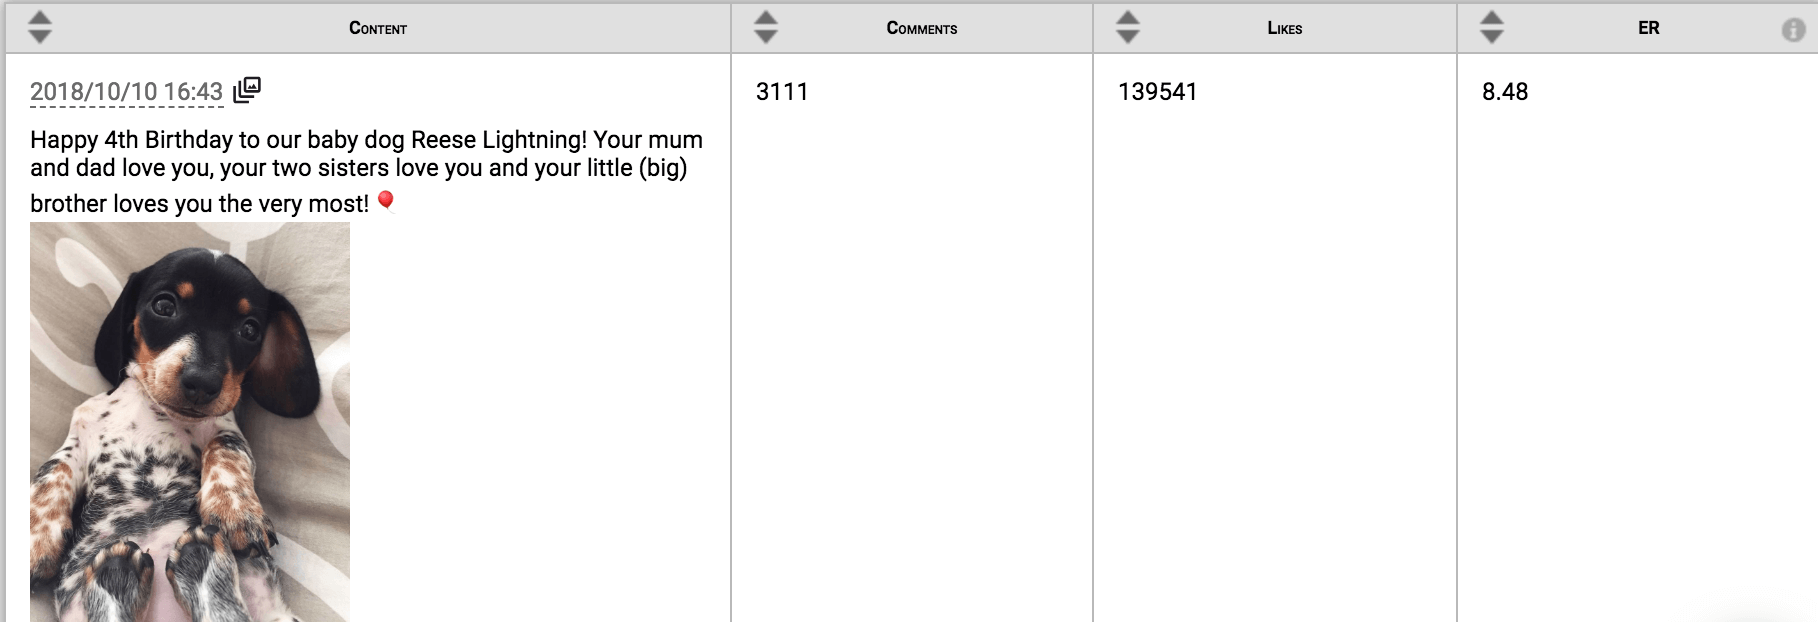
Want to dig deeper? You could also look at how engaging your content is posts by post:
If you’re using NapoleonCat, you can get insights not only on your own engagement, but also track how your competitors or favourite benchmarks are doing. This will give you a better idea of the space you’re in and how to get ahead with your Instagram efforts.
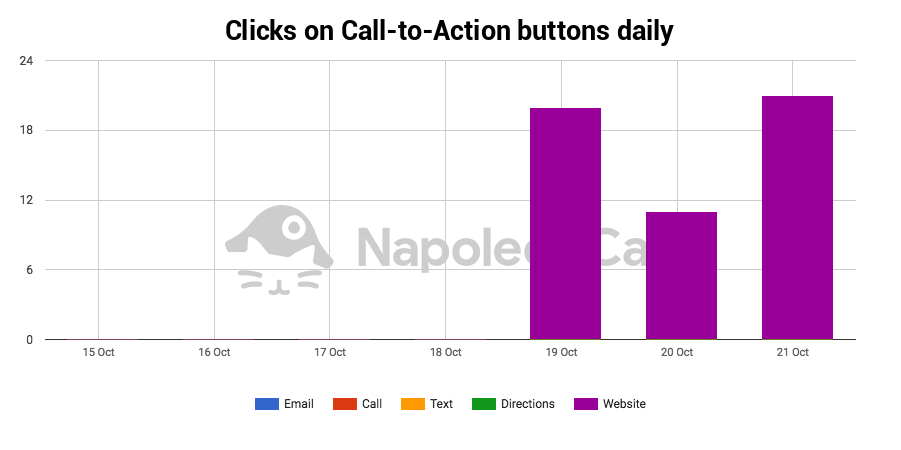
3. Am I getting conversions from Instagram?
Metric: clicks on Call-To-Action buttons
Instagram isn’t typically thought of as a platform that can drive traffic to a website or generate new leads. This is mainly because you can’t put links directly in Instagram posts. But with the launch of Instagram Business pages, the platform made it possible to set up various call-to-action buttons on the profile page (previously it was only possible to insert one link). With NapoleonCat, you can measure the click-throughs to your set CTA buttons. This makes it easier to decide whether your Instagram page could be an important touch point for your customers.
4. What hashtags should I use to increase user engagement on Instagram?
Metric: top hashtags
There are two good reasons why you should look at your best performing hashtags. The first is obvious: when you know which hashtags work best, you know you should be using them more. Hashtags in Instagram work like keywords in a search engine – the ones with most engagement are bringing you most traffic.
One way to look at hashtags that we use at NapoleonCat is hashtag cloud – a visual representation of the most popular hashtags from a given period of posting. This one was generated for a food blogger who posted about her daughter’s birthday cake that week:
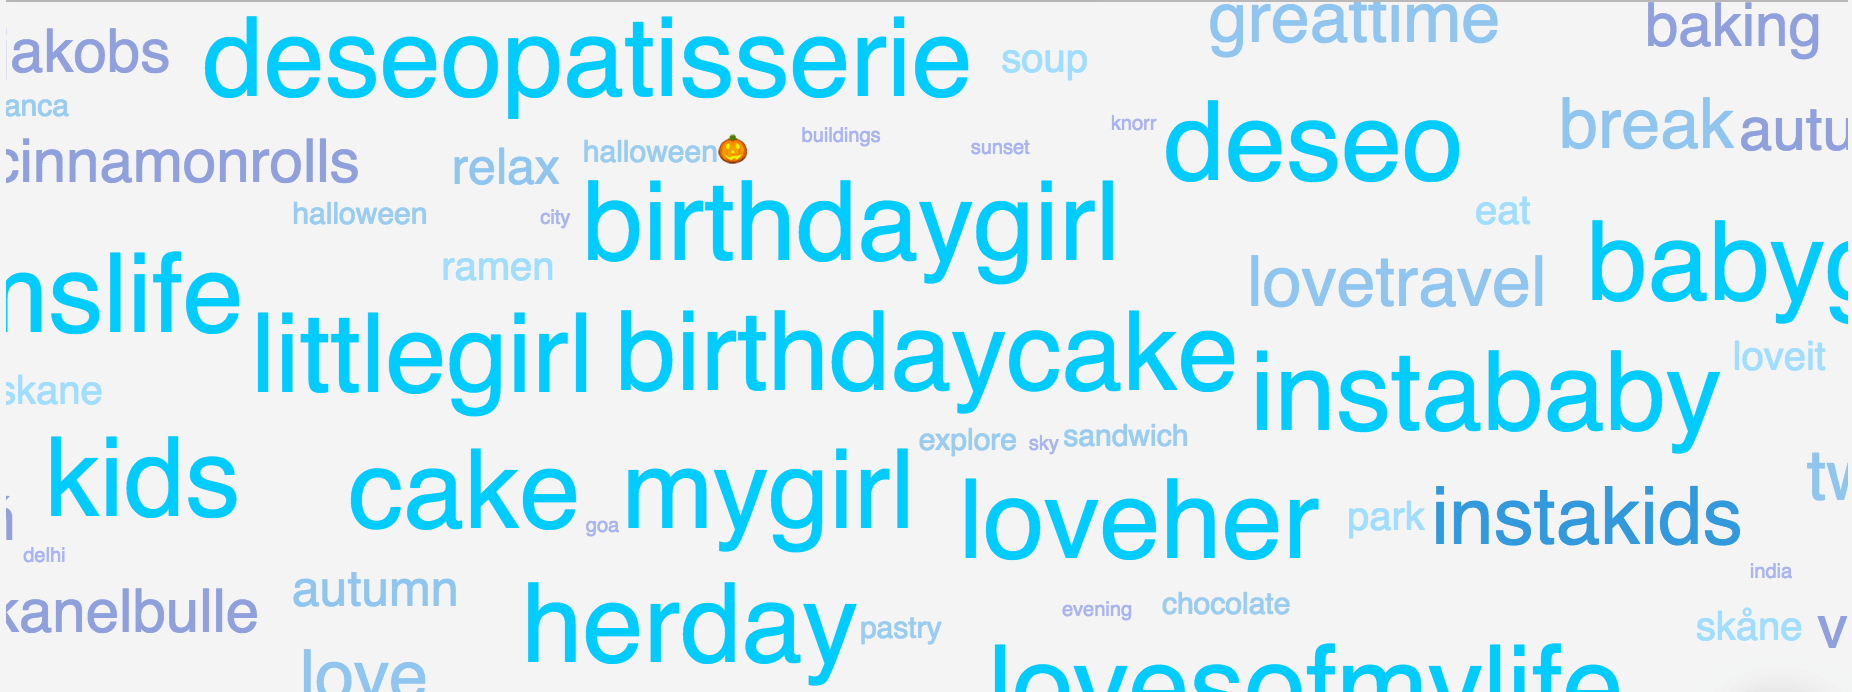
As you can see, the hashtags that performed best that week were #instababy, #birthdaycake, #herday and so on. Many other hashtags were used that week for other posts, but the little girl’s birthday celebration was an obvious winner!
What’s the second reason for looking at best performing hashtags? It helps with your content planning. You can look at the most popular hashtags over a longer period of time, say six months – and gauge which topics generated most interest and then plan your future content around that. For instance the food blogger in question could think about planning recipes for kids!
5. Which of my Insta stories engaged most people?
Metric: Stories analytics
Insta stories are a great way to get users engaged with the most recent content. They have a short lifecycle but are great for generating interest on things happening right now or giving quick updates, directing users to newly pubished content on other platforms.
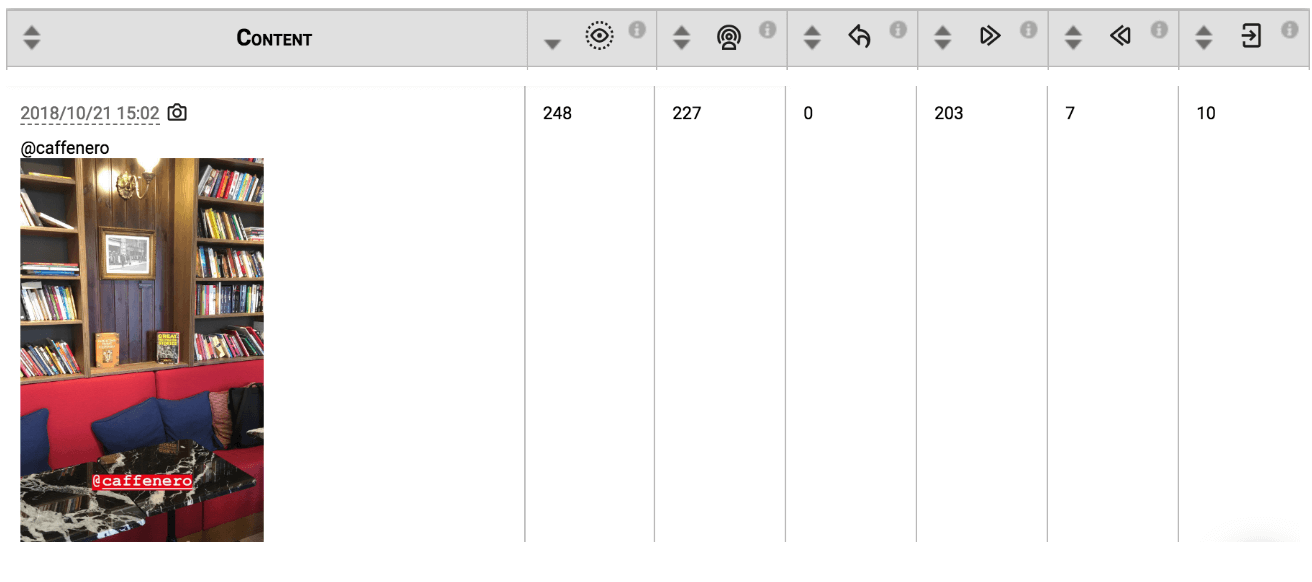
Instagram’s own analytics tool only keeps your stories for 7 days, which is very limiting if you want to really get an idea of what performed best. In NapoleonCat, you will be able to look up insights for all your stories to really see which ones were most popular. You will be able to see how many unique users viewed your story, how many replied to it and how many tapped back (to see a story again) or forward (to skip a story).
Need more help with marketing on Instagram?
So now you have a better idea of what metrics you should be looking at to evaluate your marketing efforts on Instagram. If you want to find out more about how to make the most of Instagram for your brand, and be able to manage it from desktop check out this post.
Ready for some Instagram action? Register for a FREE TRIAL.
To learn more about what you can do with NapoleonCat check out these articles.
Still have more questions about NapoleonCat? Ask us anything: [email protected].