
Save hours on social, every day.
Automate moderation and replies, schedule posts, and pull reports - all in one tool.
Social media management goes hand in hand with social media reporting. You analyze your results, draw conclusions, and then refine your strategy to reach more of your potential customers. This process goes round and round, and you’ll surely need some tools to make it all easier.
With our new product update, we’re introducing Twitter reports – a feature that will save you tons of time, and help you improve your Twitter marketing strategy.

Social media reports for Twitter
Save tons of time and try our latest Twitter reports feature. Create comprehensive reports in less than a minute.
Try NapoleonCat free for 14 days. No credit card required.
What is social media reporting?
Social media reporting is a data-driven approach to any solid marketing strategy, and it’s key to proving value to your social marketing plan. It can act as a guide through your marketing efforts.
Why do you need social media reporting?
Firstly, your boss may demand regular reports. Secondly, there are plenty of benefits in analyzing your social media accounts that will help you boost your results. Let’s list some significant benefits to social media reports:
Figure out which content performs best
Based on metrics like the user engagement rate, you can easily find out which of your posts perform best. In other words, you know better what to post.
Find your best times to post
By analyzing when your audience is most engaged, you can discover your optimal times to post, and reach more people with your content. But how, exactly, do you do that? Well, we’ve got the perfect solution.
The ultimate social media reporting tool
With NapoleonCat, the whole process of social media reporting gets automated. You can generate reports for your own profiles, as well as any other public accounts, e.g., your competitors. It takes about a minute to generate a report.

Sit back and relax
Automated reporting in NapoleonCat means more free time for you 🙂
Try NapoleonCat free for 14 days. No credit card required.
You can select a custom time period that you wish to analyze. The feature works for Facebook, Instagram, and we’ve just launched it to work for Twitter as well, so let’s focus on Twitter reports from this point on.
Key metrics for a Twitter report
While creating a new Twitter report, you can review the metrics you want it to include, so let’s break it all down:
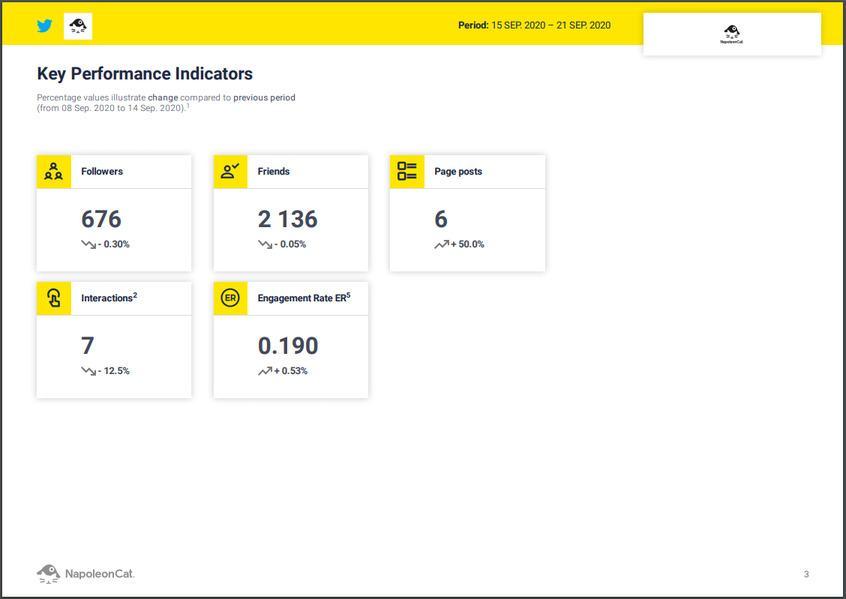
Key Performance Indicators
You’ll get all the key metrics of your account, plus the percentage values illustrating the change compared to the previous period:
- Number of followers
- Friends (accounts you follow)
- Number of page posts
- Number of interactions
- Engagement rate
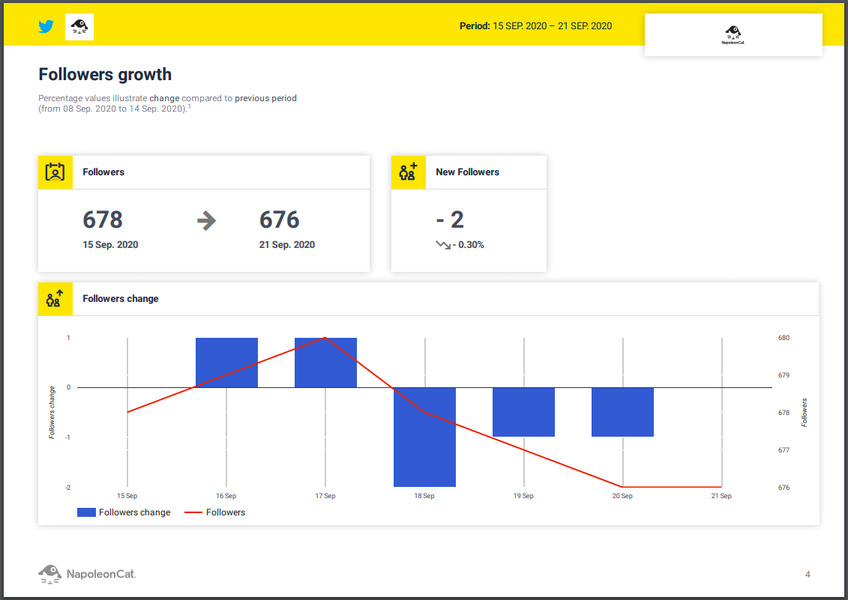
Followers growth
You’ll see a breakdown of your followers’ growth, illustrated with a graph to show you how that number changed each day.
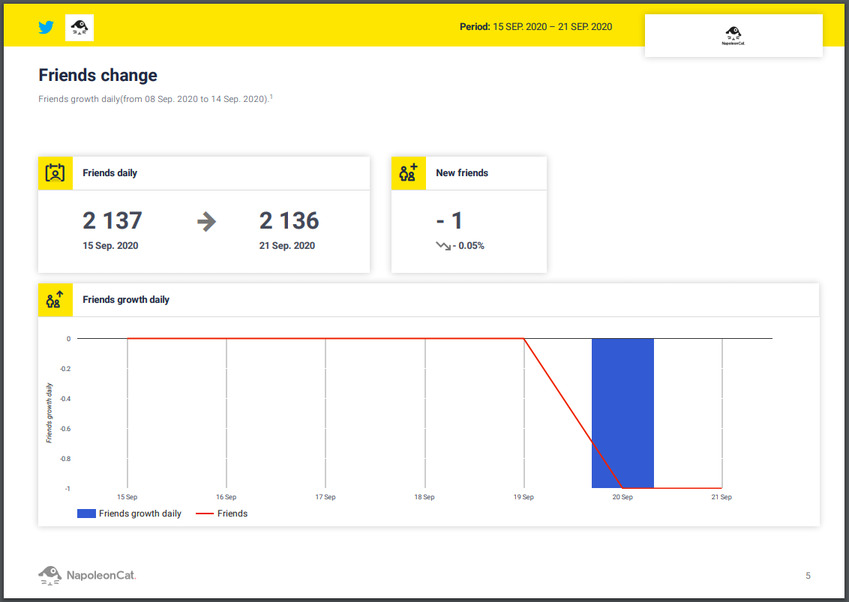
Friends growth
Analogically, you can see how the number of users you follow changed during the analyzed time period.
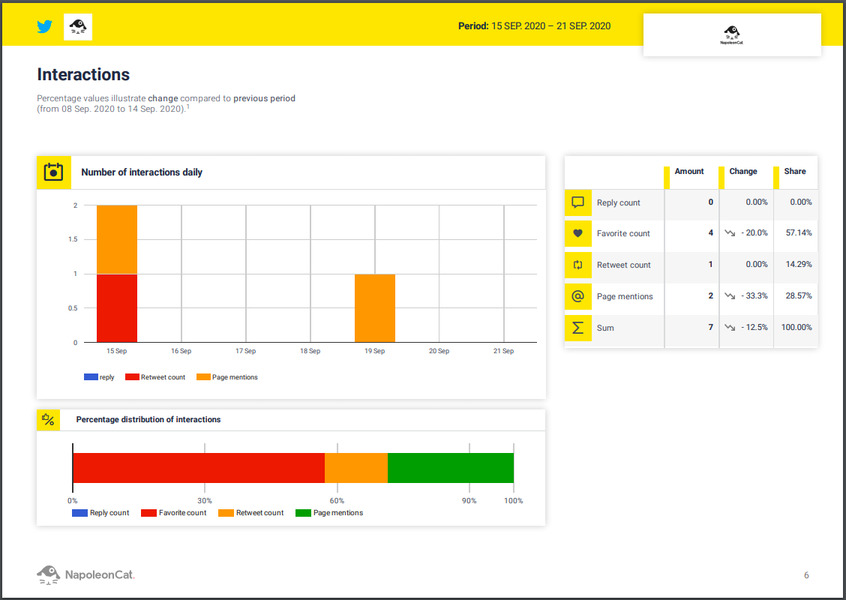
Interactions
You can see the number of interactions with your account. What counts towards interactions are the following:
- Reply count
- Favorite count
- Retweet count
- Page mentions
- Sum of all interactions
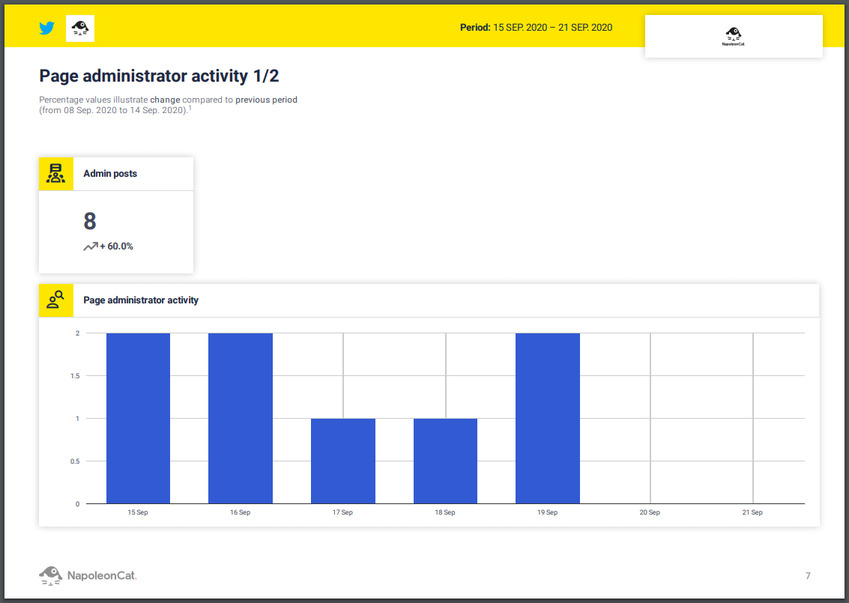
Page admin activity
The page admin activity section illustrates the number of posts published on your Twitter account each day.
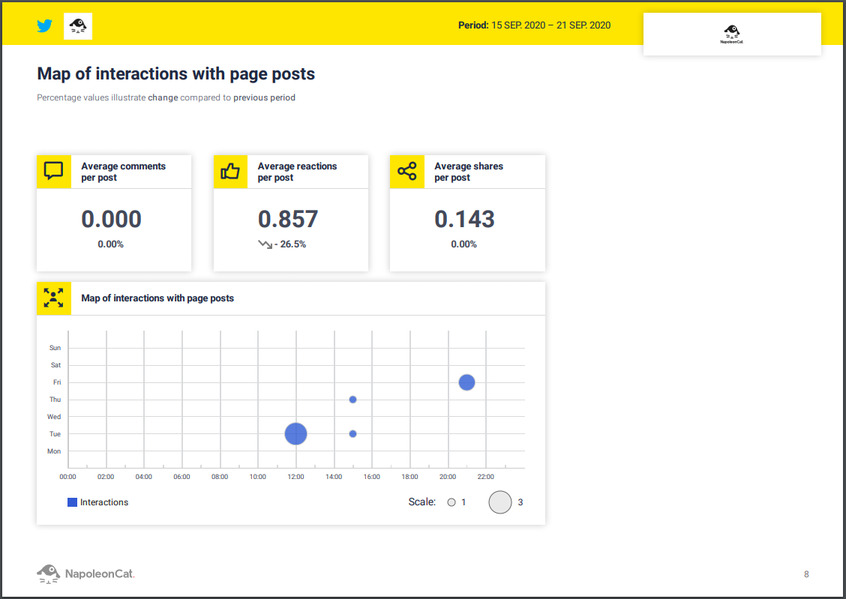
Page posts interactions heatmap
With the map of interactions, you’ll also get to find out how people interact with your content. It illustrates the following metrics:
- Average comments per post
- Average reactions per post
- Average shares per post
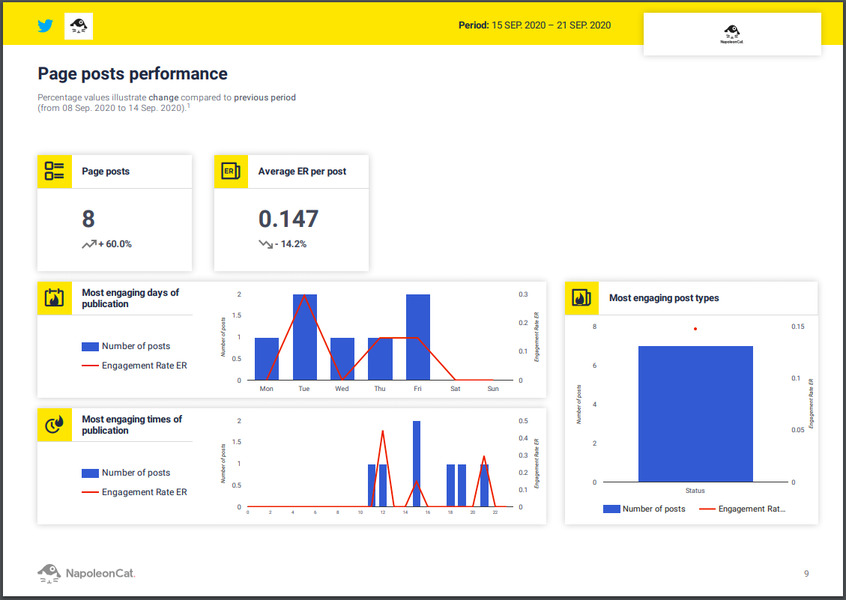
Page posts performance
With this report section, you can find out what kind of content your audience engaged with the most, and also which days and times generated the highest user engagement. This information is crucial in establishing the next steps of your social strategy. You find out which kind of posts performs best, and then start posting at the most optimal times to maximize their potential and reach a wider audience. You’ll see metrics like:
- Average ER per post
- Most engaging days of publication
- Most engaging times of publication
- Most engaging post types
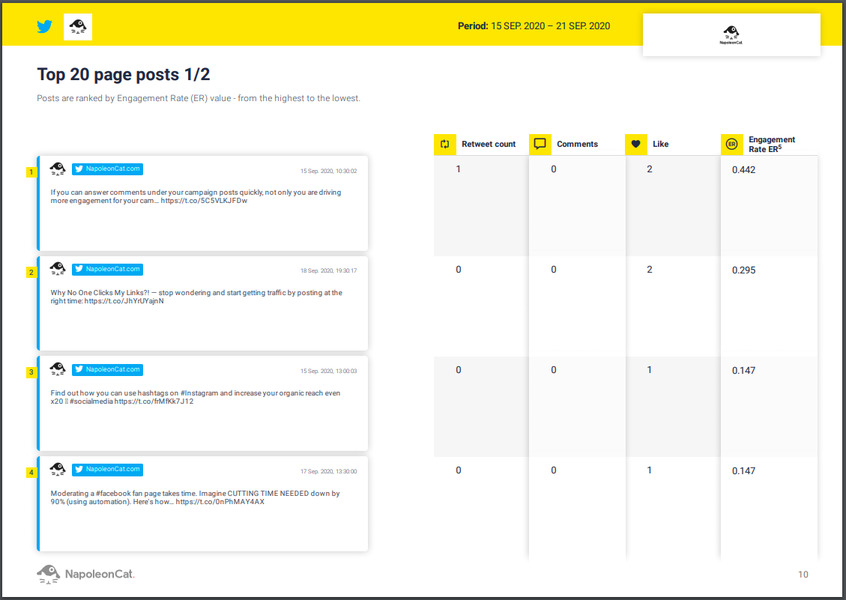
Top 20 page posts
You’ll find out how well specific posts performed in the top 20 page posts report section.
How to generate & schedule a Twitter report
Here’s a video tutorial showing you how to create, and how to schedule reports in NapoleonCat. This was done for an Instagram account, however, the only differences are the default metrics that the report includes.
Creating a report takes about a minute (give or take). All you need to do is:
- Access the Reports module in NapoleonCat.
- Click on “Create new report”
- Choose the desired time period for your analysis
- You can upload your own logo and hide NapoleonCat branding from your report
- Choose the social media profile
- Lastly, you review the metrics that you wish to include in your report. By default, all metrics are selected.
You can also schedule your reports and have them sent to you and other people automatically. You can choose weekly, monthly, or quarterly reports.
To schedule a report:
- Go to the Reports module in NapoleonCat
- Click on “Schedule report”
- Type in the emails of the people you wish to have the report automatically delivered to.
- Choose weekly, monthly, or quarterly reports
- The rest is done in the same way as creating a new report.
Bonus feature: Competitive analysis
Analyzing your competitors on social media is almost just as important as analyzing your own profiles. With NapoleonCat, you can generate reports not only for your own Twitter accounts but also for any other public profiles. This will give you more benchmarks, more ideas for content creation, and simply more data to work with whilst creating or improving your social strategy. Below is a sample report:
To see how you can track competitors on Twitter using NapoleonCat, check out this article.
Automate social media reporting
Generate in-depth reports for Facebook, Instagram, and Twitter with just a few clicks.
Try NapoleonCat free for 14 days. No credit card required.